Market Turbulence: From Optimism To Disappointment

Ulli Market Commentary Contact

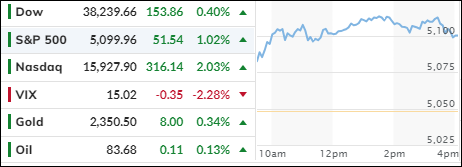
[Chart courtesy of MarketWatch.com]

  1. Moving the markets

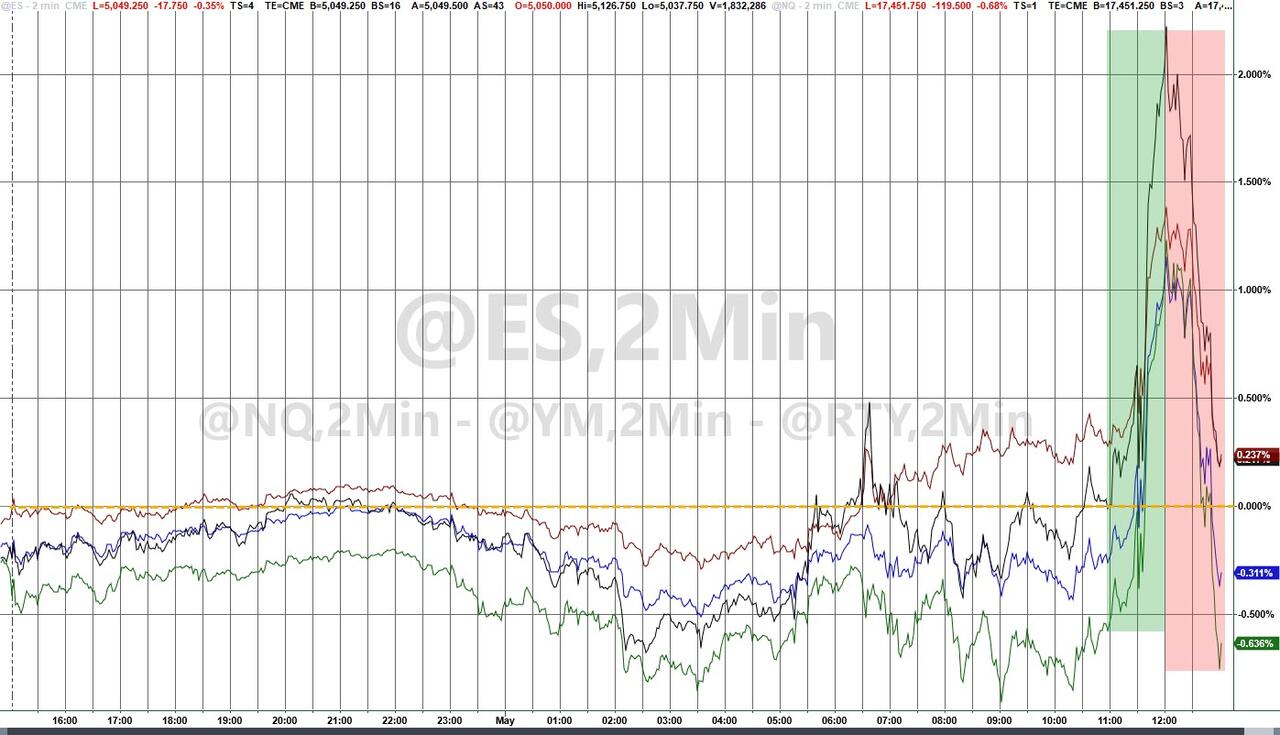
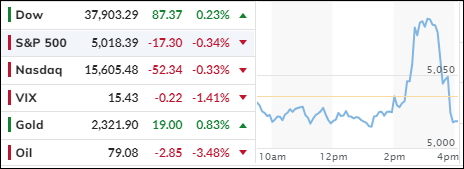
Today, Wall Street witnessed a rollercoaster ride as the major indexes initially surged in response to the Federal Reserve’s decision to keep interest rates unchanged. However, this early enthusiasm gave way to disappointment as the S&P 500 and Nasdaq reversed course and ended the day in negative territory.

Fed Chair Jerome Powell cited a “lack of further progress” in taming inflation as the reason for maintaining rates. Inflation remains stubbornly high, and the path ahead is uncertain. But the Fed did signal a gradual approach to tightening financial conditions by slowing the pace of quantitative tightening—allowing maturing bonds to roll off the balance sheet without reinvesting them.

Traders welcomed this measured approach, but elsewhere, stocks tied to artificial intelligence faced headwinds. Advanced Micro Devices, Super Micro Computer, and Nvidia all grappled with disappointing reports.

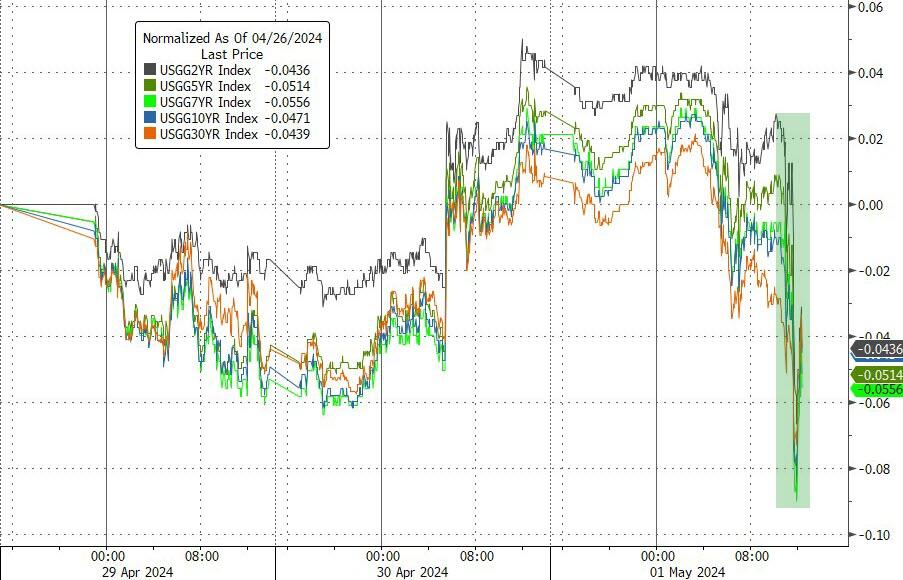
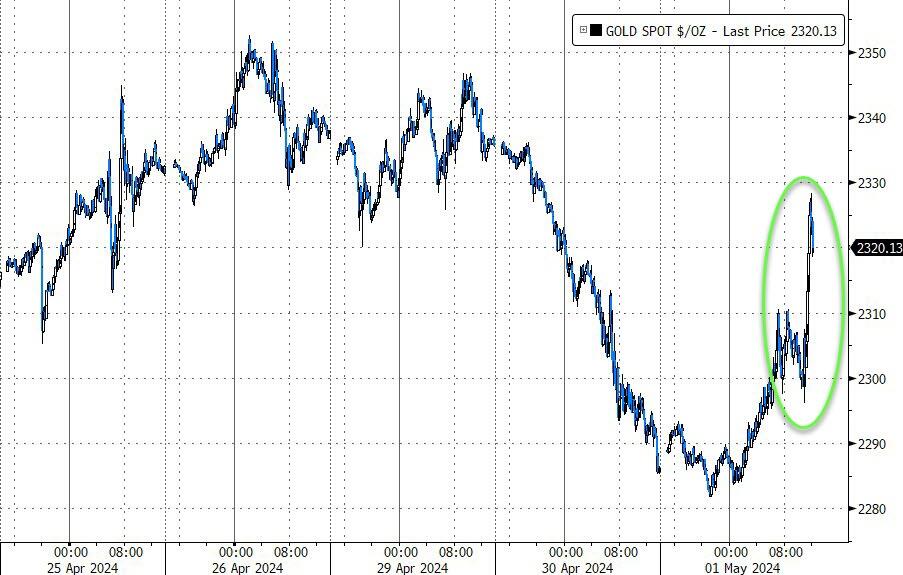
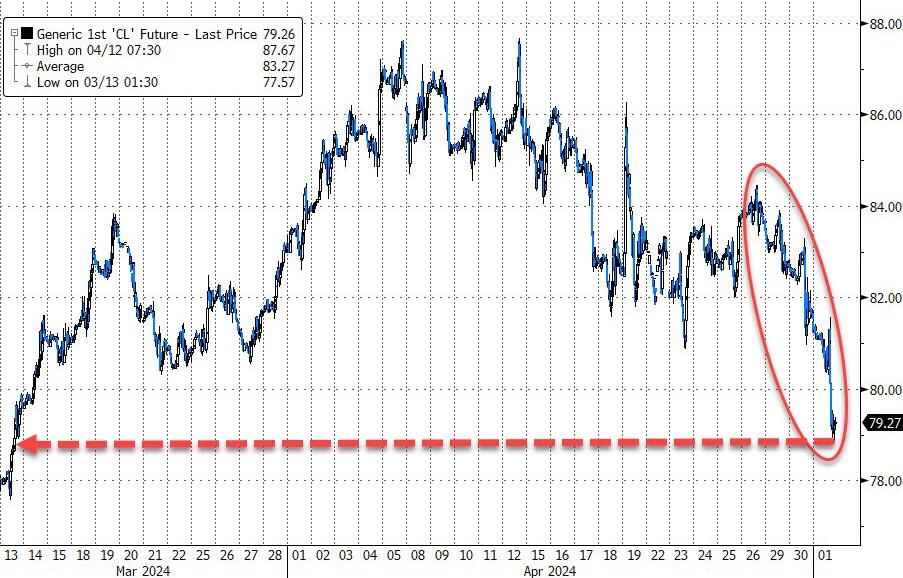
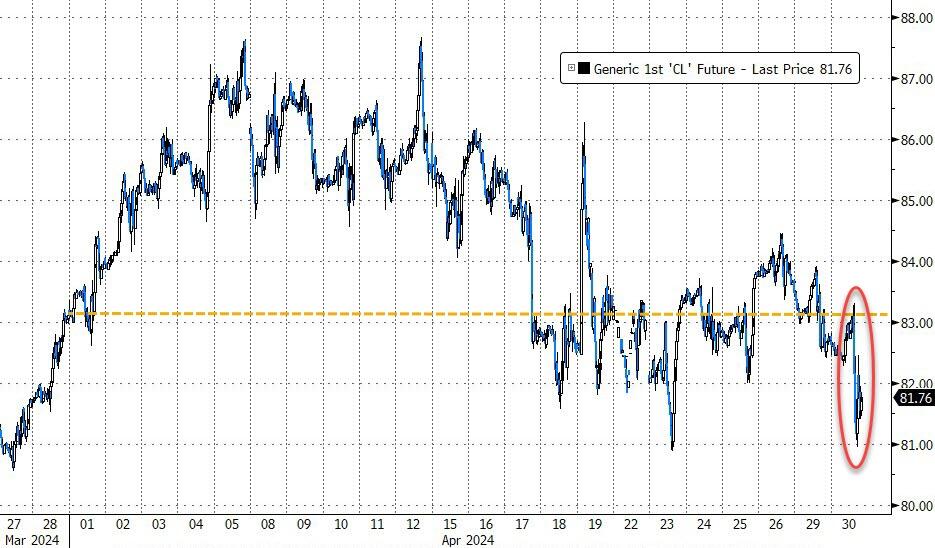
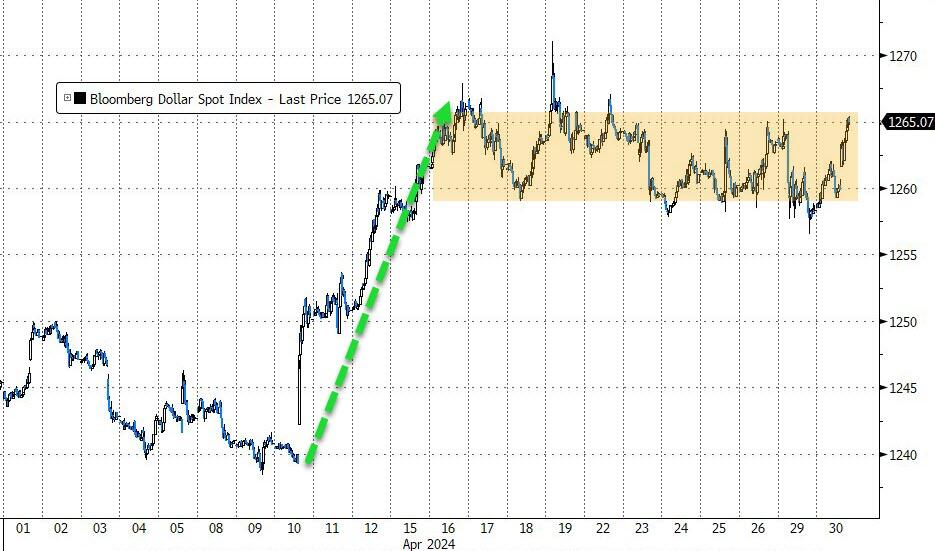
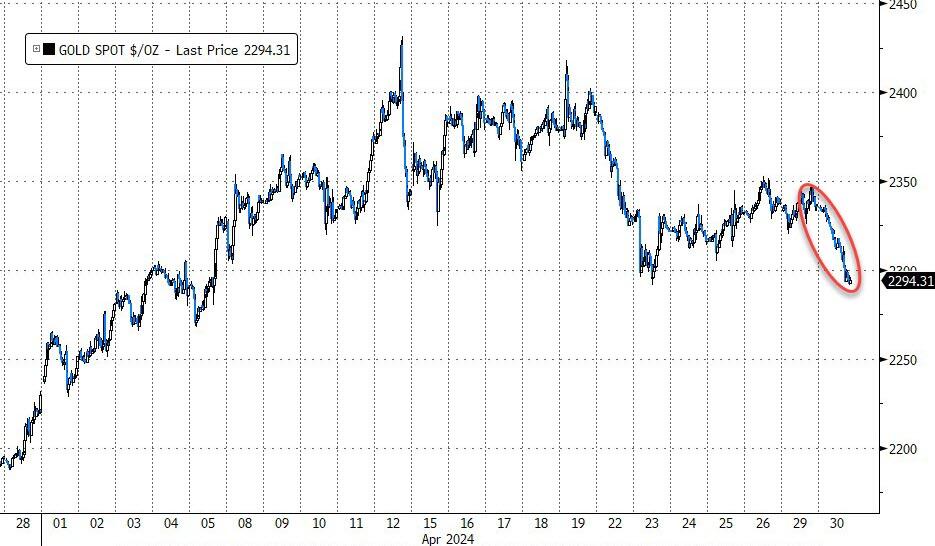
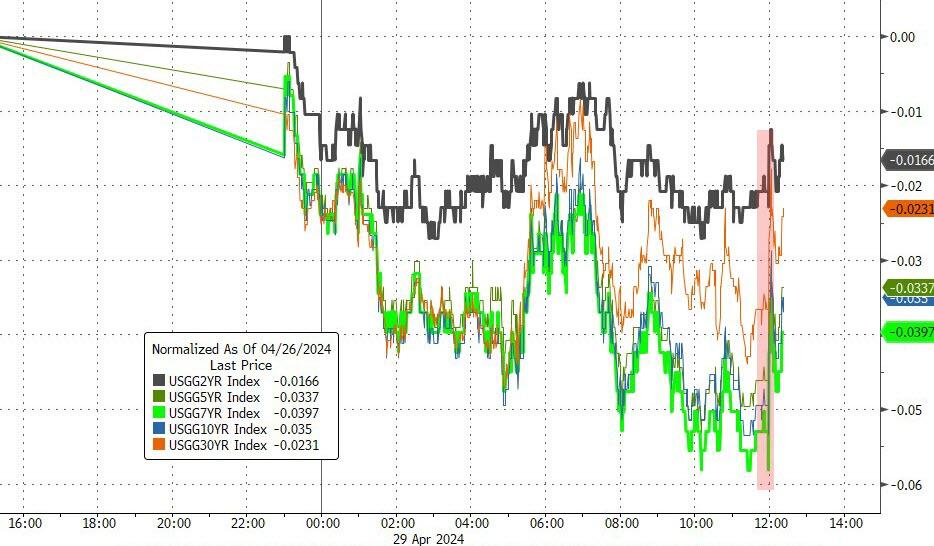
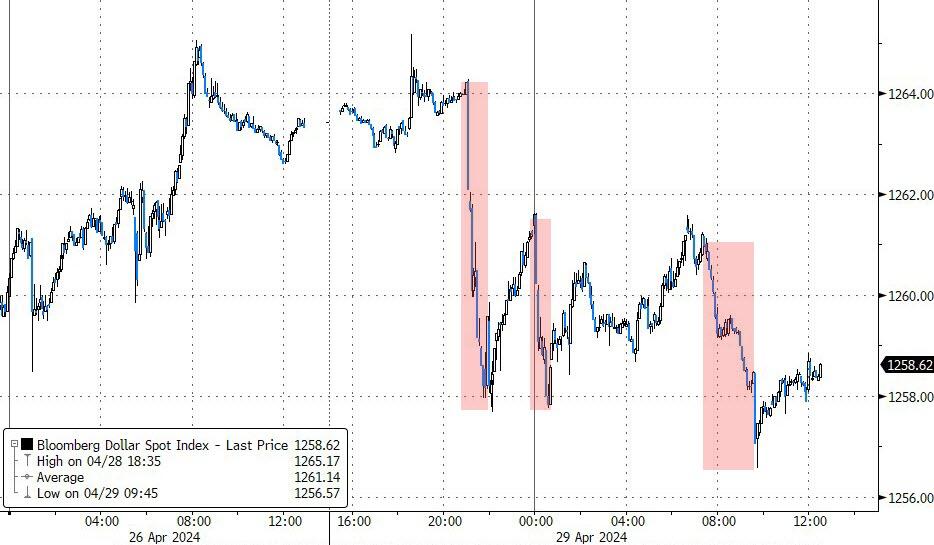
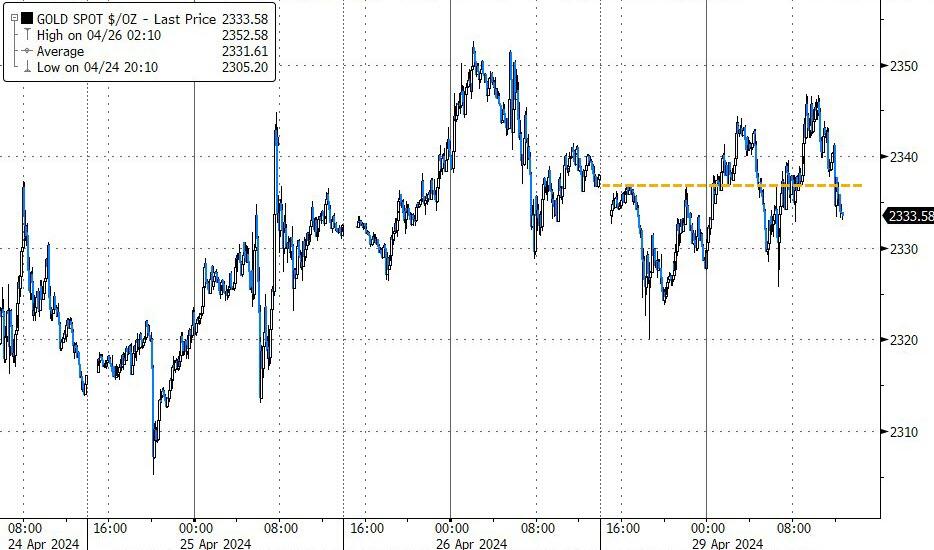
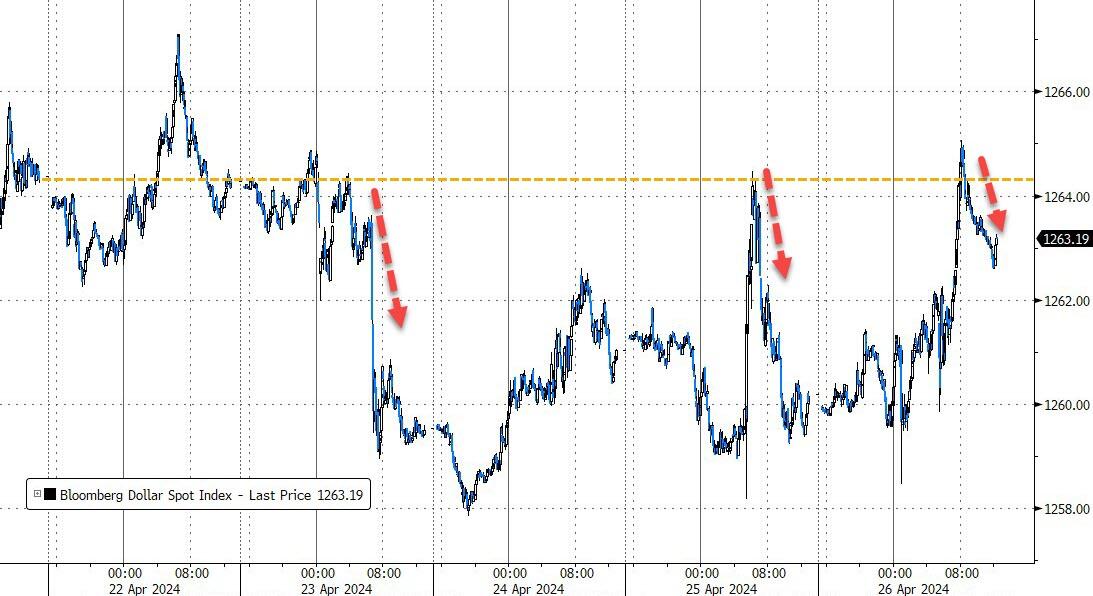
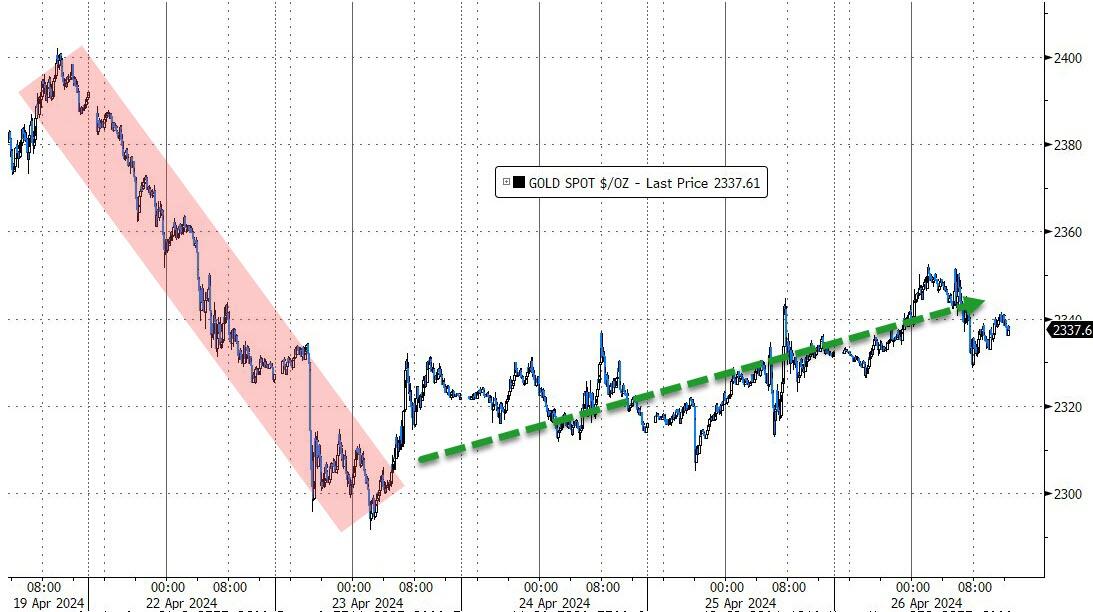
Shorted stocks experienced a massive squeeze, while bond yields dropped, the dollar fluctuated but gold surged back above its $2,300 level. Bitcoin got dragged down with stocks, and crude oil followed the same theme.

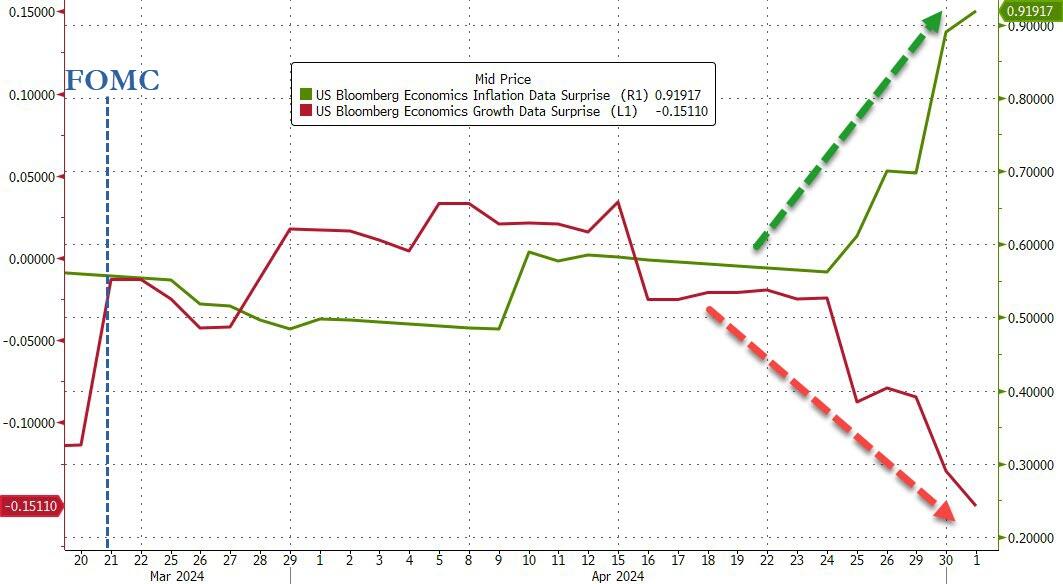
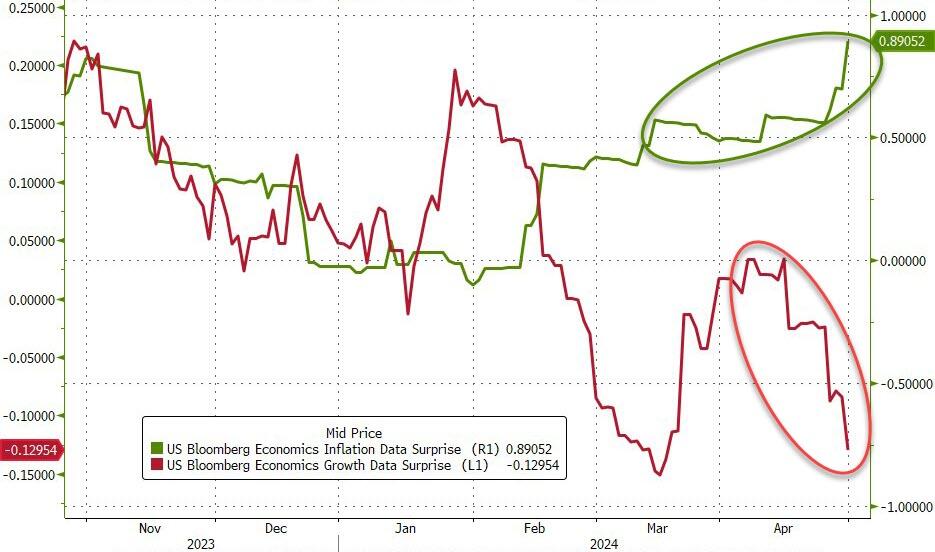
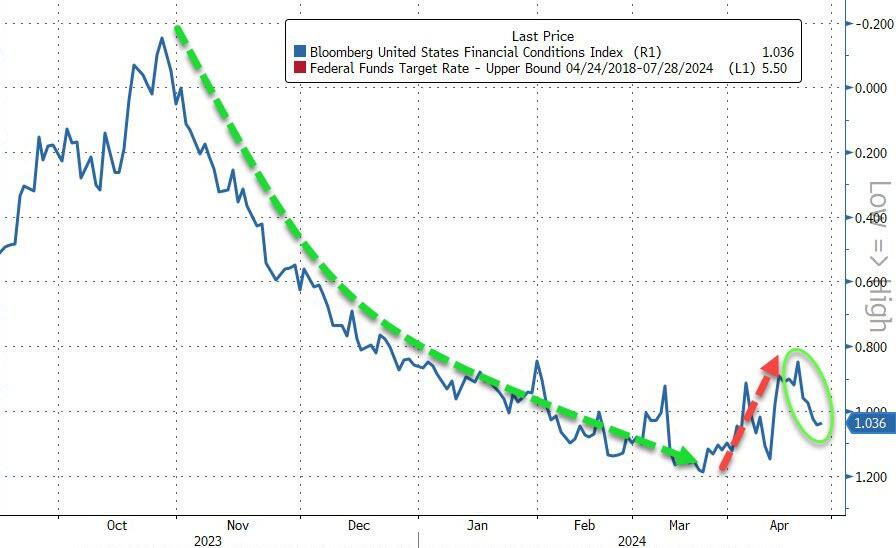
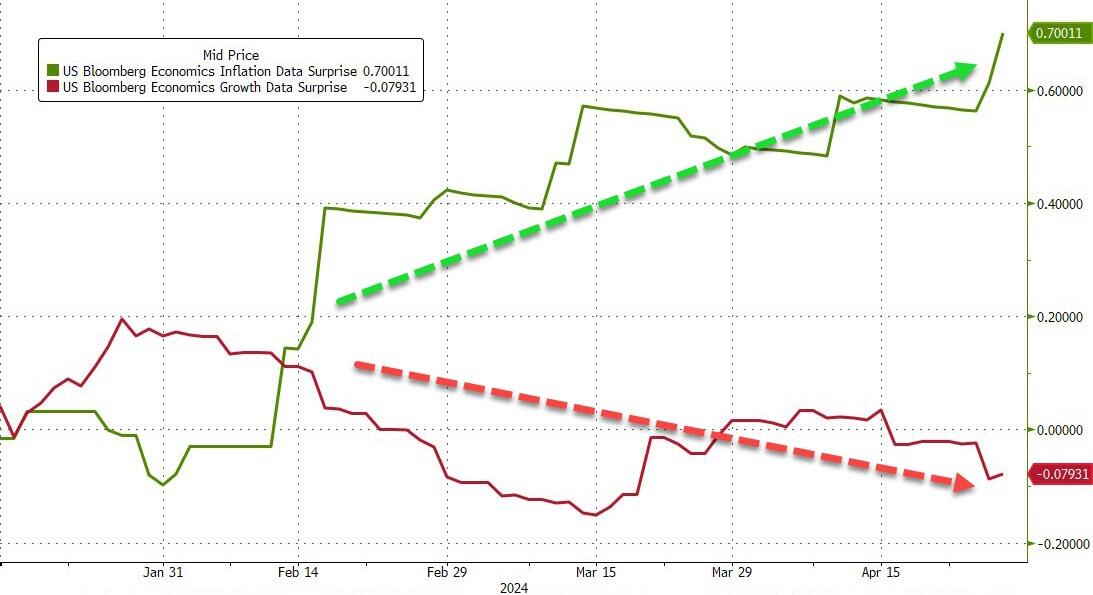
Fed head Powell elaborated on not seeing stagflation, but maybe he missed this chart from Bloomberg, which makes the current condition abundantly clear.

Read More
April’s Market Turmoil: Wage Data Sparks Inflation Fears And Rate Speculation

Ulli Market Commentary Contact

[Chart courtesy of MarketWatch.com]

  1. Moving the markets

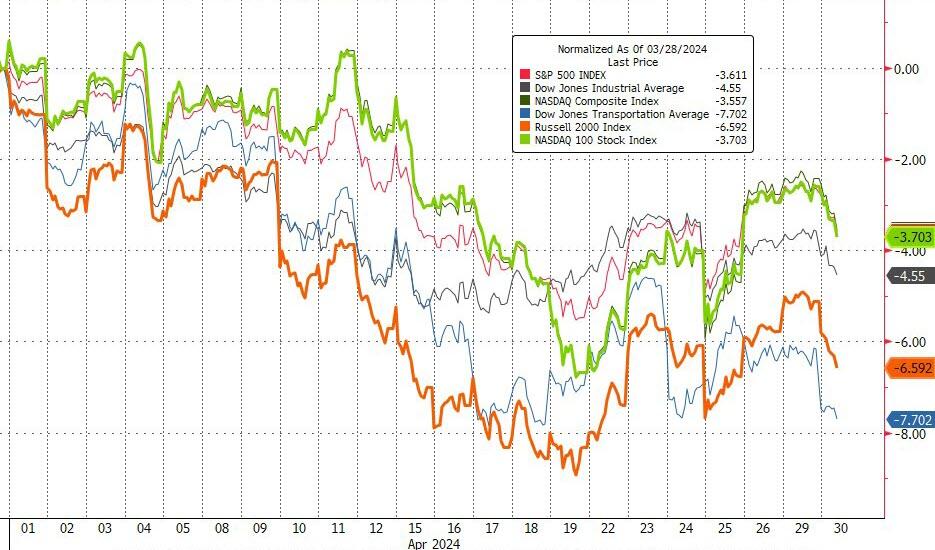
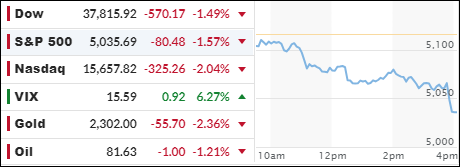
As April ended, the major stock indexes concluded the month on a downward trajectory, spurred by wage data that surpassed expectations and reignited concerns about inflation. This comes just before the Federal Reserve’s impending interest rate decision.

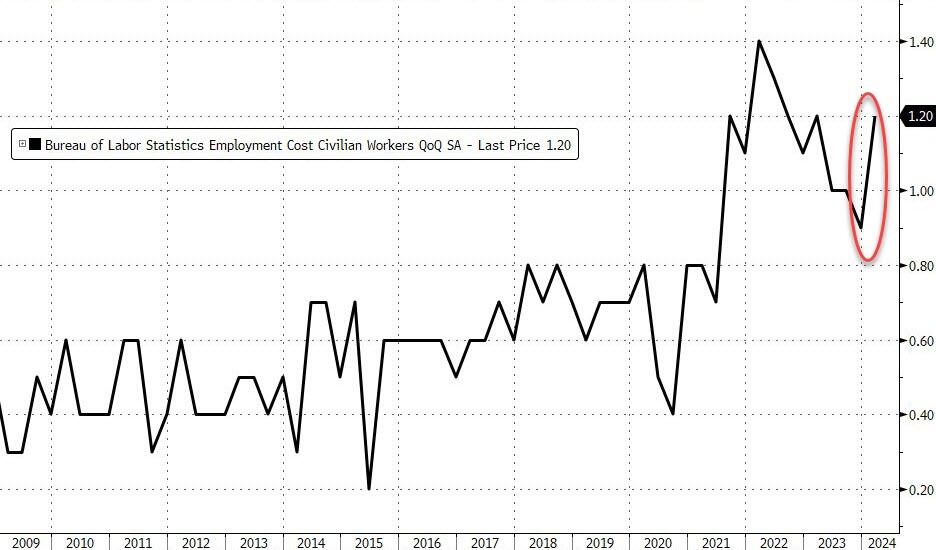
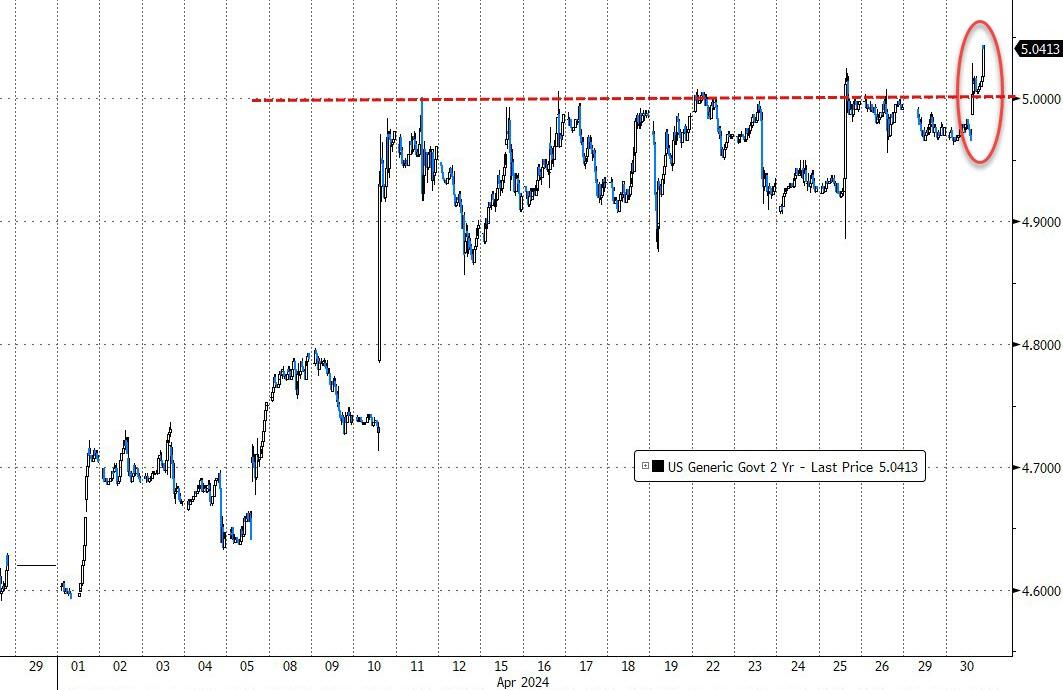
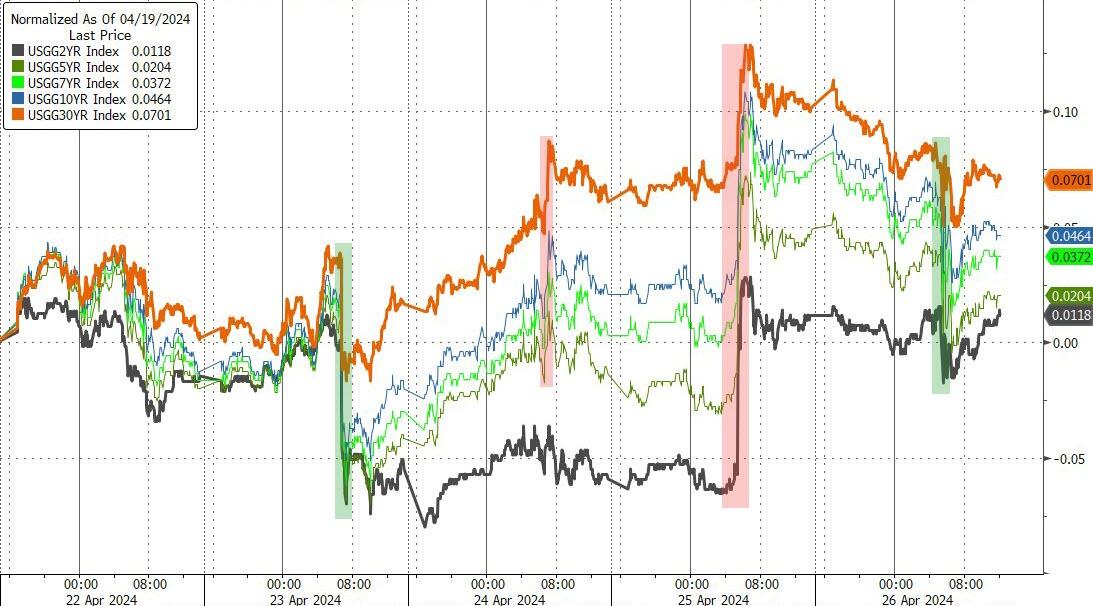
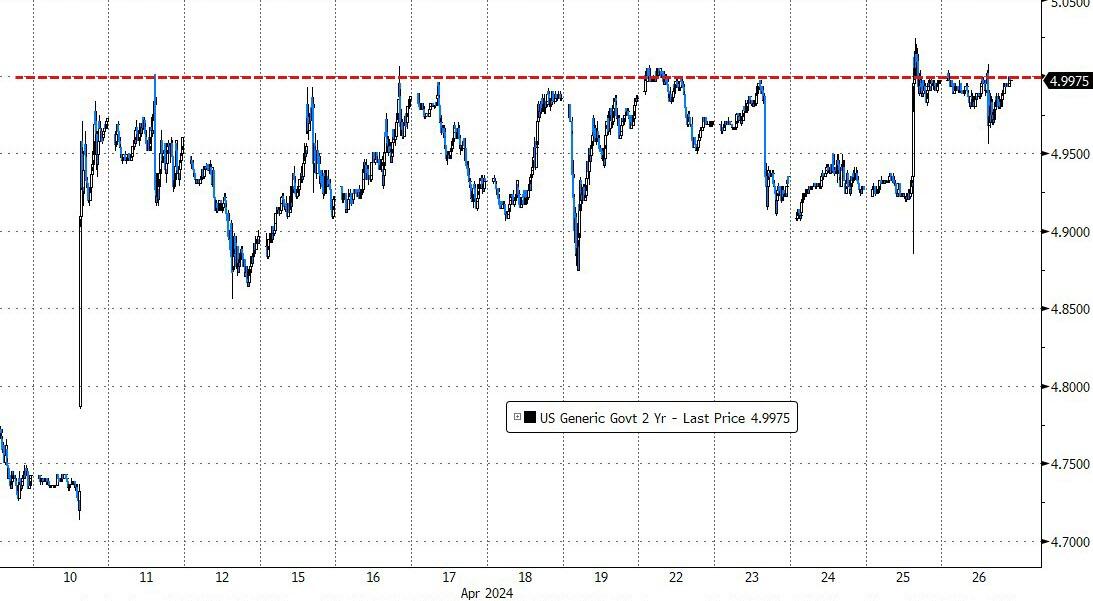
The employment cost index, which tracks wages and benefits, rose by 1.2% in the March quarter, exceeding the predicted 1%. This news prompted a surge in Treasury yields, with the 2-year yield surpassing and holding the 5% threshold for the first time.

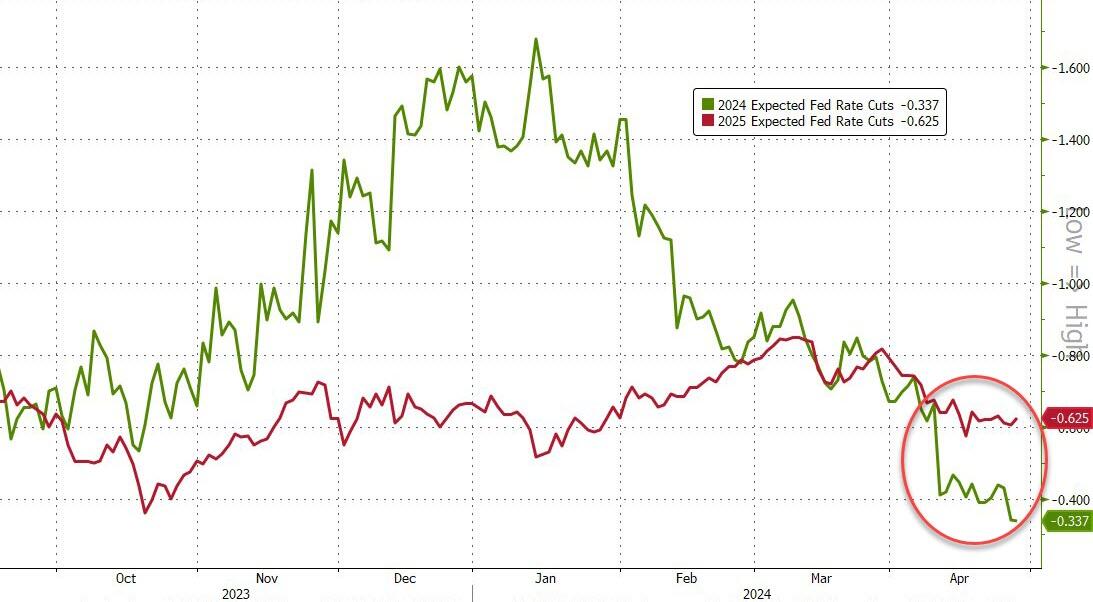
Despite these figures, Wall Street remains unconvinced that the Federal Reserve will shift its current stance of not rushing to ease monetary policy. Similarly, the data does not seem to be compelling enough to prompt an immediate increase in interest rates. Traders continue to anticipate a modest rate cut of one quarter percentage point in 2024, even as persistent inflation and a robust economy suggest that the Fed may maintain higher rates for an extended period.

The central bank is widely expected to maintain the current interest rates, but there is growing concern that Jerome Powell, the Fed Chair, may express a more hawkish outlook in his comments following the meeting, especially considering recent reports indicating rising inflation.

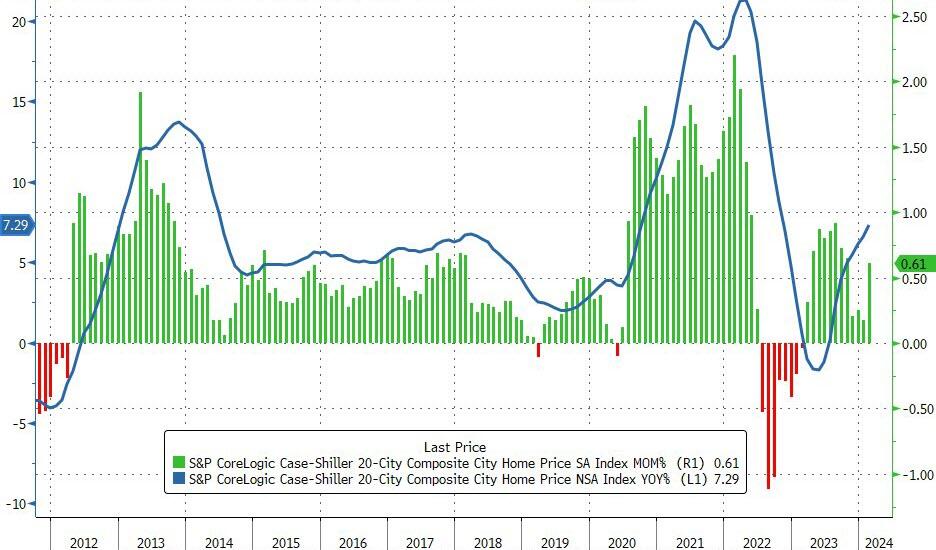
The trading day was marred by a series of negative economic indicators: Case-Shiller home prices surged unexpectedly, consumer confidence plummeted, and the Dallas Fed Services index fell sharply.

The markets floundered, with stocks, bonds, crude oil, and Bitcoin all weakening as the month concluded. However, the dollar experienced a rally. Gold, despite suffering losses on the day, managed to post solid gains for the month.

April marked the first month of losses for stocks since the Federal Reserve’s policy shift in October 2023. It was the most challenging month for the Dow Jones Industrial Average since September 2022, and the Nasdaq experienced its most significant monthly decline since September 2023.

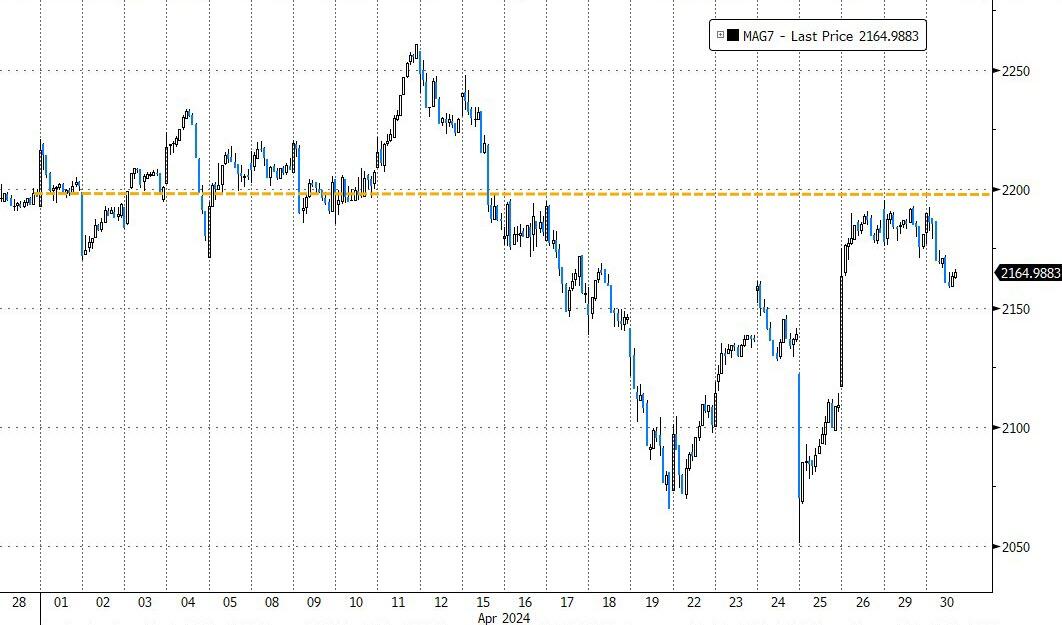
The group of MAG 7 stocks, which includes some of the largest tech companies, also ended the month in the red, recording their first monthly loss since October and their worst performance since September.

Given the current economic landscape, I can’t help but wonder:

When will the Nasdaq align with the lowered expectations for rate cuts?

Read More

Mixed Signals: April’s Market Dance

Ulli Market Commentary Contact

[Chart courtesy of MarketWatch.com]

  1. Moving the markets

[Chart courtesy of MarketWatch.com]

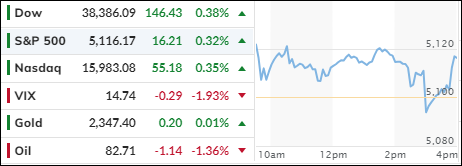
In today’s market session, traders witnessed a cautious upward trajectory with a hint of optimism. The major indexes, guided by selected mega-cap technology stocks, edged higher. However, beneath the surface, conflicting forces played out.

Tesla, the electric vehicle giant, surged nearly 11% after overcoming a significant regulatory hurdle related to its full self-driving technology in China. Meanwhile, Apple enjoyed a more than 3% boost following a bullish upgrade from investment firm Bernstein. However, other tech heavyweights—Microsoft, Alphabet, Meta, and Nvidia—struggled and traded lower.

The ongoing earnings season paints a mixed picture. Of the S&P 500-listed firms that have reported results so far, approximately 80% have surpassed expectations. This positive trend underscores the resilience of corporate America amid economic challenges.

Today’s action provided a reprieve from the recent market downtrend, yet it was marked by choppiness. The broad S&P 500 and tech-heavy Nasdaq are both poised to end April down more than 2%, while the blue-chip Dow faces a potential slide of over 3%. Investors remain cautiously optimistic, balancing short-term volatility with long-term prospects.

Later this week, all eyes will be on the Federal Reserve’s latest interest rate announcement, scheduled for Wednesday. While the central bank is widely expected to maintain borrowing costs unchanged, traders eagerly await Chair Jerome Powell’s post-announcement press conference. Will the Fed’s communication provide clarity on inflation concerns and the path forward?

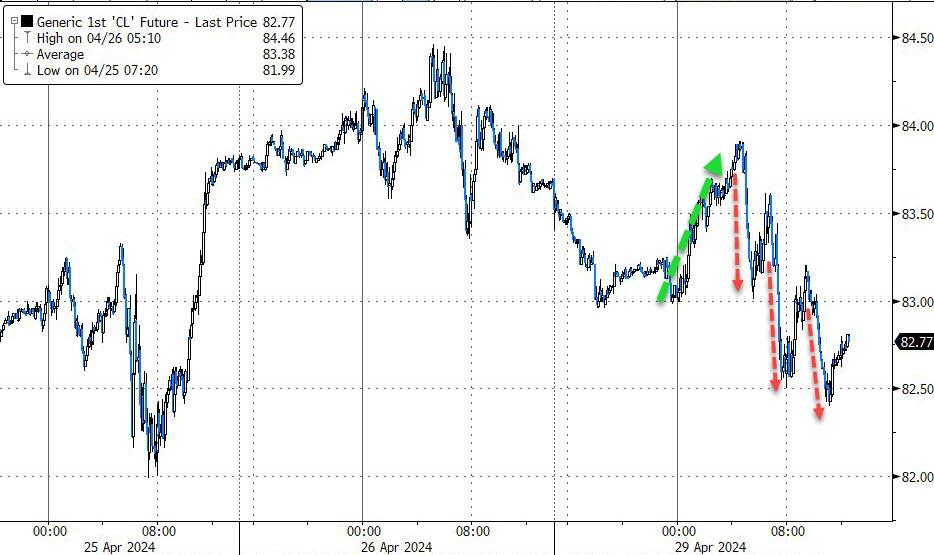
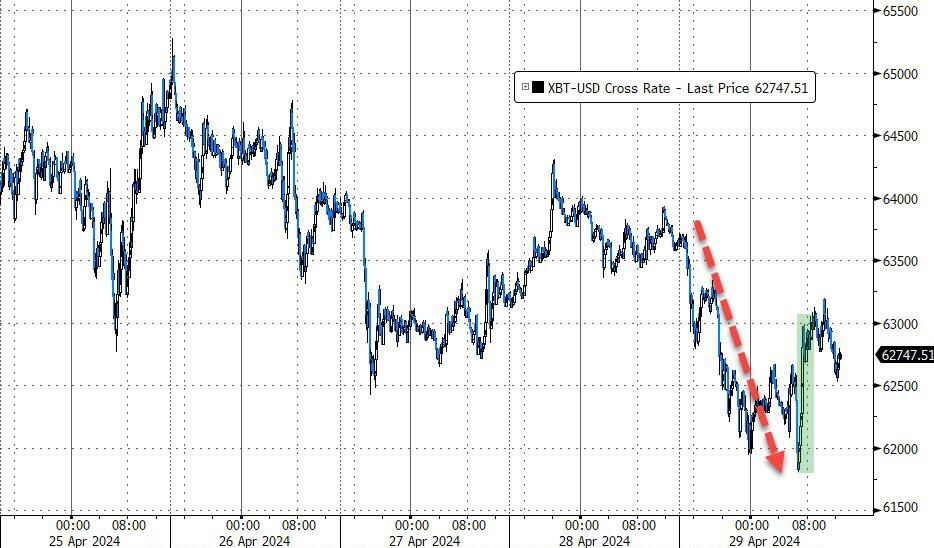
Bond yields experienced a knee-jerk reaction, remaining below Friday’s close. The dollar initially bounced but ultimately retreated during the session. Gold maintained a quiet stance, treading water. Crude oil not only lost momentum but also dipped below the $83 mark. Bitcoin drifted lower but found support around $62,000.

As financial conditions ease once again, I wonder:

Will the Fed introduce any surprises on Wednesday? Inflation remains a persistent concern, and the central bank’s stance could sway market sentiment.

Read More
ETFs On The Cutline – Updated Through 04/26/2024

Ulli ETFs on the Cutline Contact

Do you want to know which ETFs are hot and which ones are not? Then you need my High-Volume ETF Cutline report. It tells you how close or far each of the 311 ETFs I follow is from its long-term trend line (39-week SMA). These are the ETFs that trade more than $5 million a day, so they are not some obscure funds that nobody cares about.

The report is split into two parts: The winners that are above their trend line (%M/A), and the losers that are below it. The yellow line is the line of shame that separates them. You can see how many ETFs are in each group and how they have changed since the last report (228 vs. 242 current).

Take a peek:

The HV ETF Master Cutline Report

If you are confused by some of the terms we use, don’t panic. I have a helpful Glossary of Terms for you.

If you want to learn more about the Cutline method and how it can make you rich (or at least less poor), read my original post here.

ETF Tracker Newsletter For April 26, 2024

Ulli ETF Tracker Contact

ETF Tracker StatSheet          

You can view the latest version here.

BIG TECH EARNINGS PROPEL STOCKS: ALPHABET AND MICROSOFT LEAD THE CHARGE

[Chart courtesy of MarketWatch.com]

  1. Moving the markets

In today’s dynamic stock market, Big Tech giants Alphabet and Microsoft took center stage, fueled by robust earnings reports. Alphabet’s stock surged over 10%, marking its most impressive performance since July 2015. Meanwhile, Microsoft posted a solid 3% gain on the back of strong fiscal third-quarter results.

The positive sentiment extended beyond individual stocks. Investors found encouragement in March’s core personal consumption expenditures (excluding food and energy), which rose by 2.8% year-on-year—surpassing the expected 2.7%. Personal spending also exceeded estimates, growing by 0.8%.

These developments helped major stock indexes regain their footing after yesterday’s downturn. However, the blue-chip Dow faced headwinds, sliding 375 points due to concerns about economic slowdown and persistent inflation but scoring a modest gain today.

Traders remain optimistic, asserting that rate cuts are unnecessary for the bull market’s continuation. Instead, they anticipate sustained economic expansion and robust corporate profits—already evident among market giants—to propel stock prices to new highs.

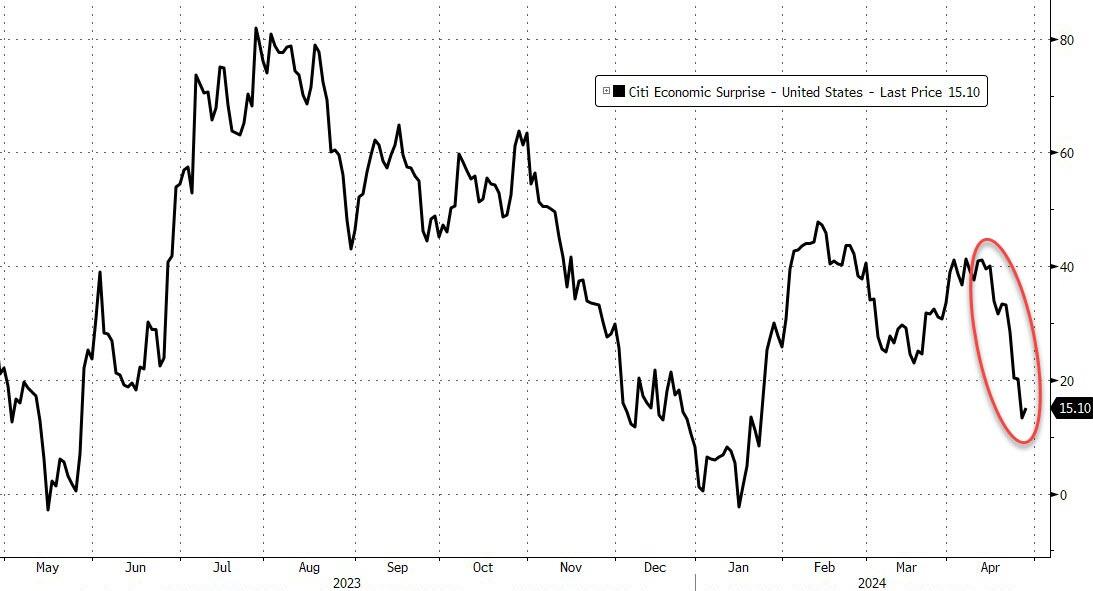
Remarkably, despite rising rates, higher inflation, and lower growth, stocks defied expectations. The combination of these factors painted a picture of stagflation, leading the Citi Economic Surprise index to deteriorate and rate-cut expectations to hit new cycle lows.

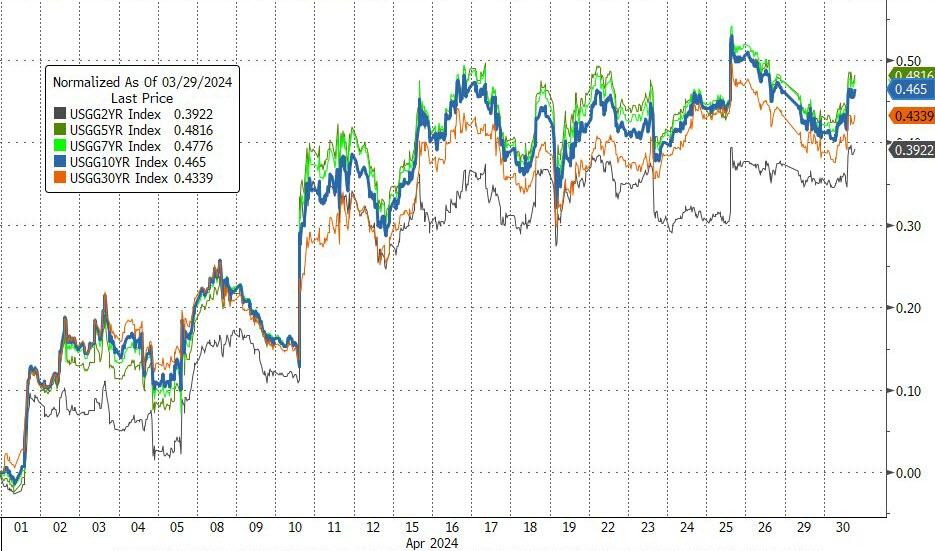
Bond yields surged across the board, with the 2-year yield still hovering around 5%. Interestingly, the Nasdaq outperformed, gaining 4%, while the Dow lagged.

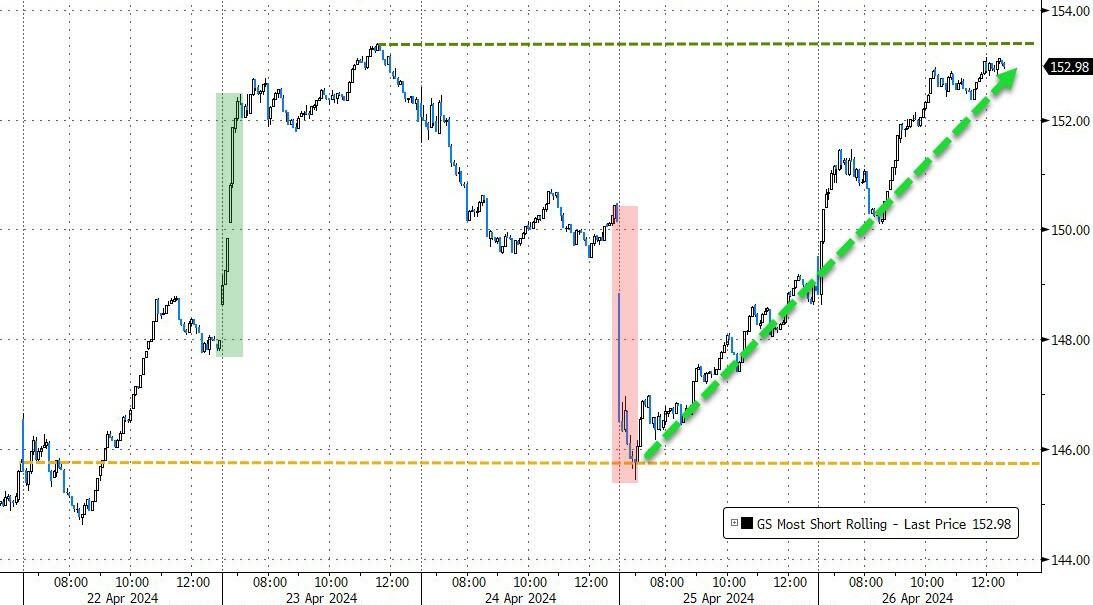
The positive momentum received an additional boost from the most significant short squeeze since March’s first week. This propelled the MAG7 stocks up by over 5% this week, although META faced challenges and tanked. Notably, Tesla, Google, and Microsoft played a pivotal role in lifting the overall market sentiment.

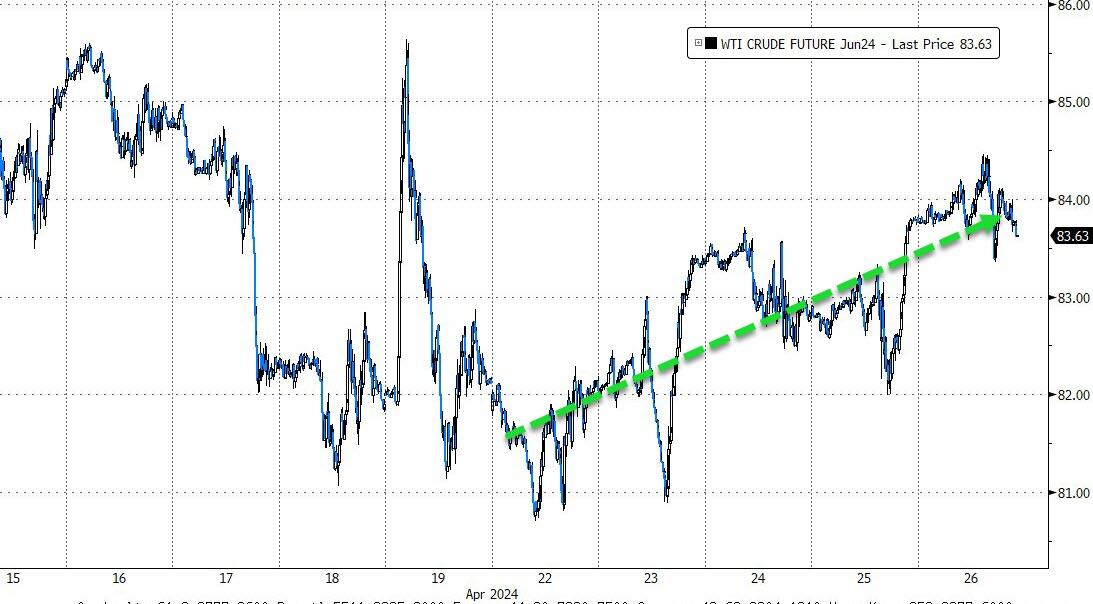
Despite the market’s wild gyrations, the dollar ended the week unchanged. Gold, although slipping, found support at the $2,300 level, while crude oil finally rallied after two weeks of decline.

However, heightened volatility in recent weeks leaves me pondering:

Can Powell’s upcoming FOMC meeting restore calmness to the markets?

Read More
Weekly StatSheet For The ETF Tracker Newsletter – Updated Through 04/25/2024

Ulli ETF StatSheet Contact

ETF Data updated through Thursday, April 25, 2024

How to use this StatSheet:

  1. Out of the 1,800+ ETFs out there, I only pick the ones that trade over $5 million per day (HV ETFs), so you don’t get stuck with a lemon that nobody wants to buy or sell.
  1. Trend Tracking Indexes (TTIs)

These are the main indicators that tell you when to buy or sell Domestic and International ETFs (section 1 and 2). They do that by comparing their position to their long-term M/A (Moving Average). If they cross above, and stay there, it’s a green light to buy. If they fall below, and keep going, it’s a red light to sell. And to make sure you don’t lose your shirt if things go south, I also use a 12% trailing stop loss on all positions in these categories.
  1. All other investment areas don’t have a TTI and should be traded based on the position of each ETF relative to its own trend line (%M/A). That’s why I call them “Selective Buy.” In other words, if an ETF goes above its own trend line, you can buy it. But don’t forget to use a trailing sell stop of 12%, or less if you’re feeling nervous.

If some of these words sound like Greek to you, please check out the Glossary of Terms and new subscriber information in section 9.

  1. DOMESTIC EQUITY ETFs: BUY— since 11/21/2023

Click on chart to enlarge

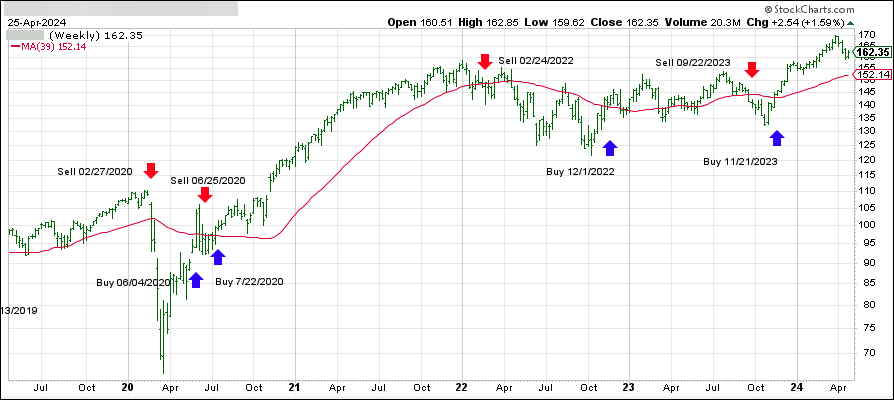
This is our main compass, the Domestic Trend Tracking Index (TTI-green line in the above chart). It has broken above its long-term trend line (red) by +6.89% and is in “Buy” mode as posted.

Read More