The stock market lost its appetite as bond prices went down and interest rates went up. The U.S. economy also showed some surprising strength, making the Fed less likely to cut rates.
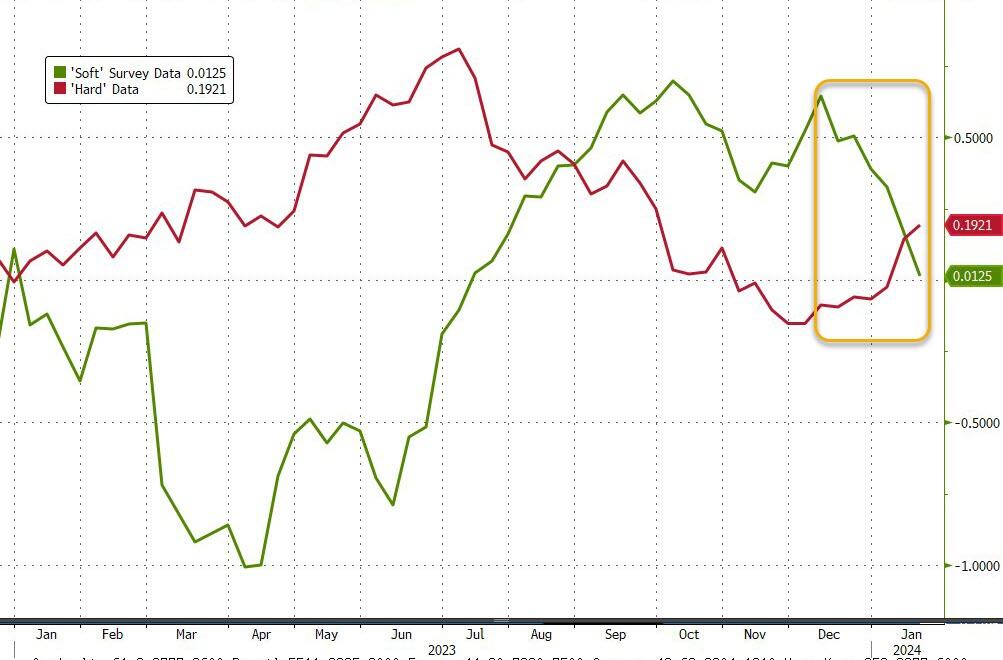
ZeroHedge summed it up like this: Retail sales: hot; Housing: sizzling; Industrial Production: – not bad. The ‘real’ numbers are looking good, while the ‘soft’ surveys are tanking. Bottom line: the economy is growing too fast for the Fed to lower rates, and the market knows it.
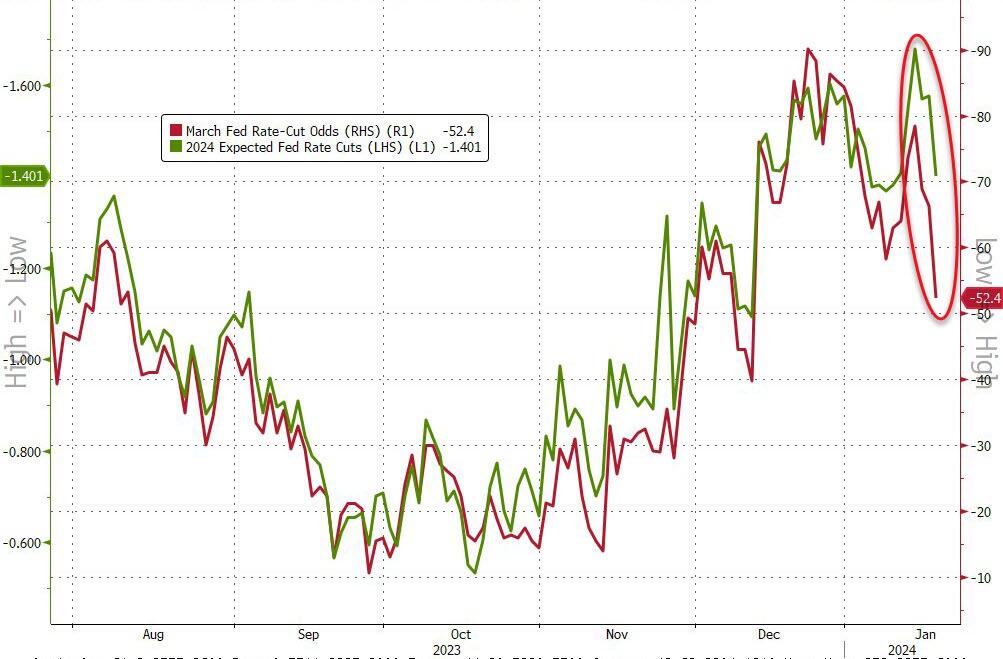
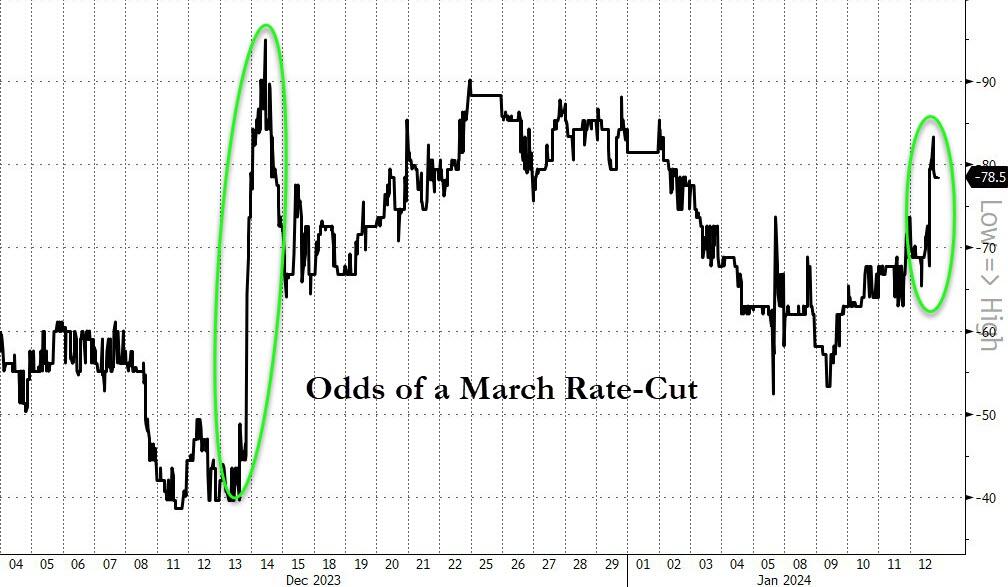
But traders are still hoping for a miracle, and betting on a 52% chance that the Fed will start cutting rates in March.
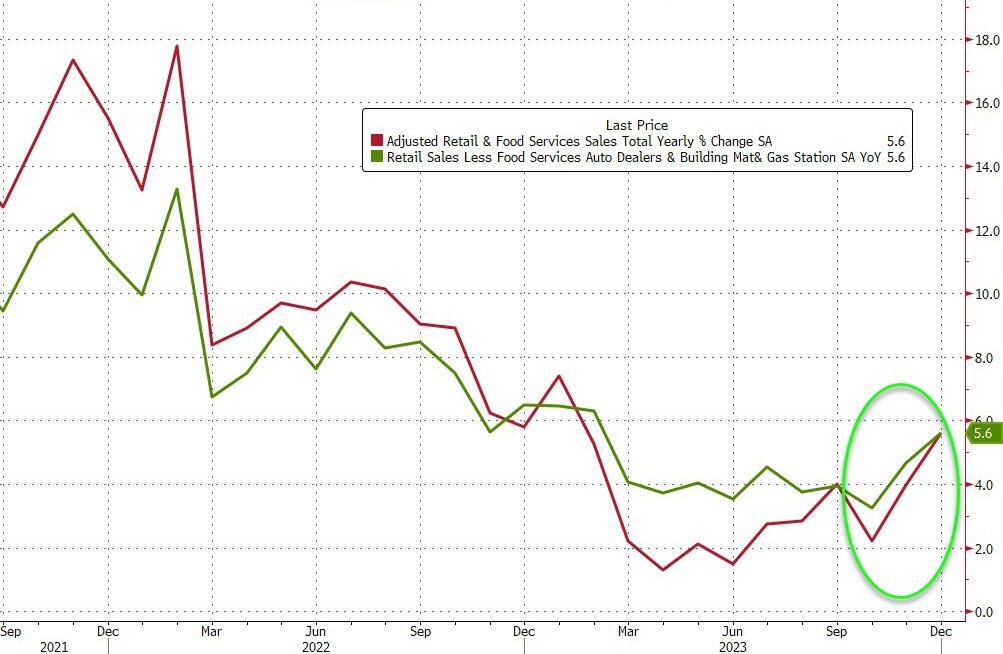
The December retail sales report was a big boost for the economy, and a big blow for the rate-cutters. Consumers were spending like crazy, even without cars.
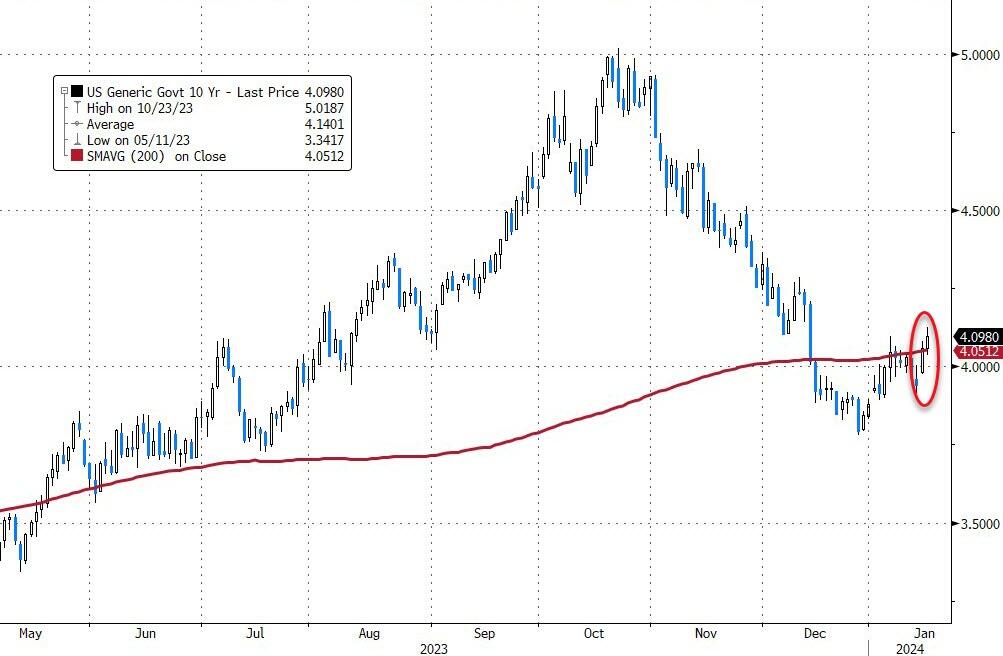
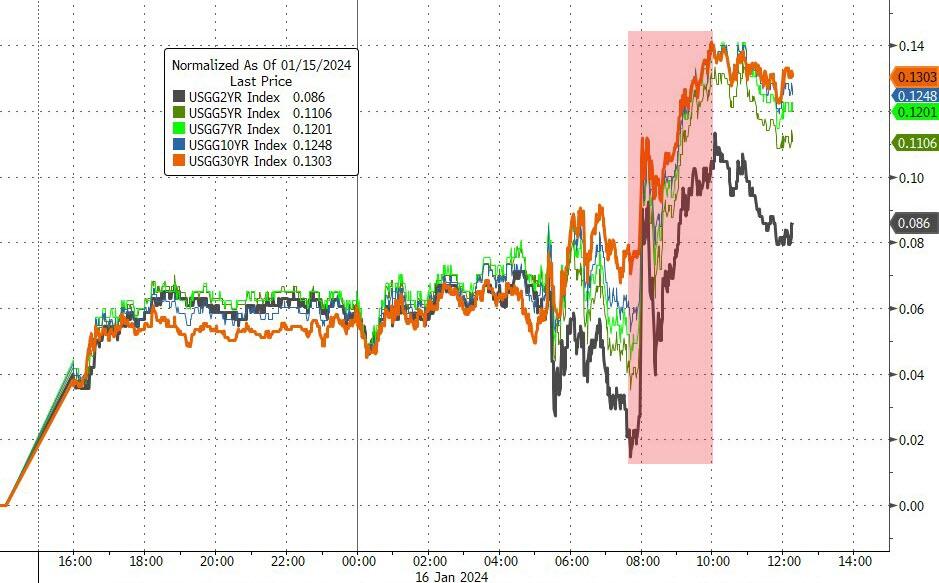
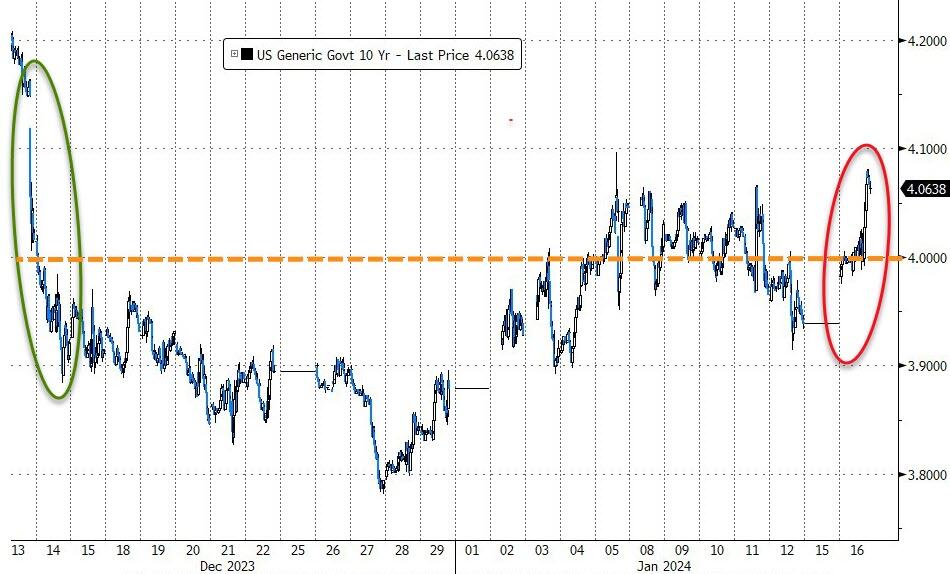
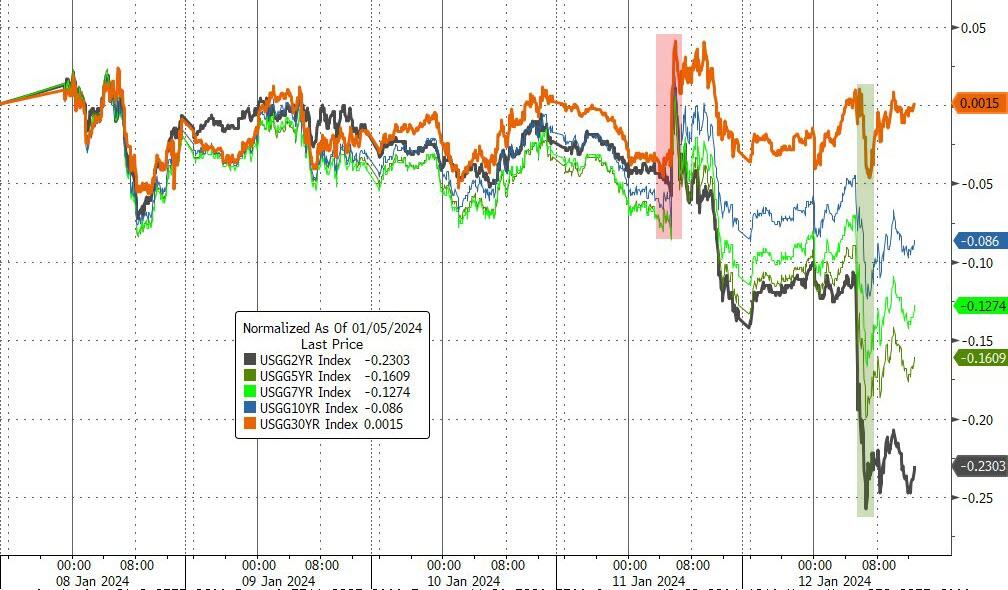
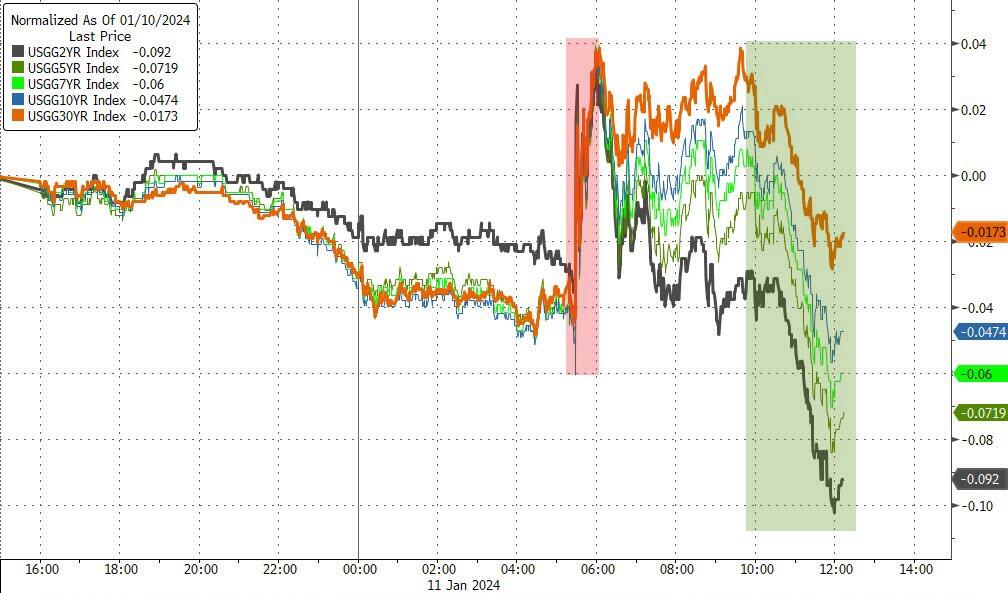
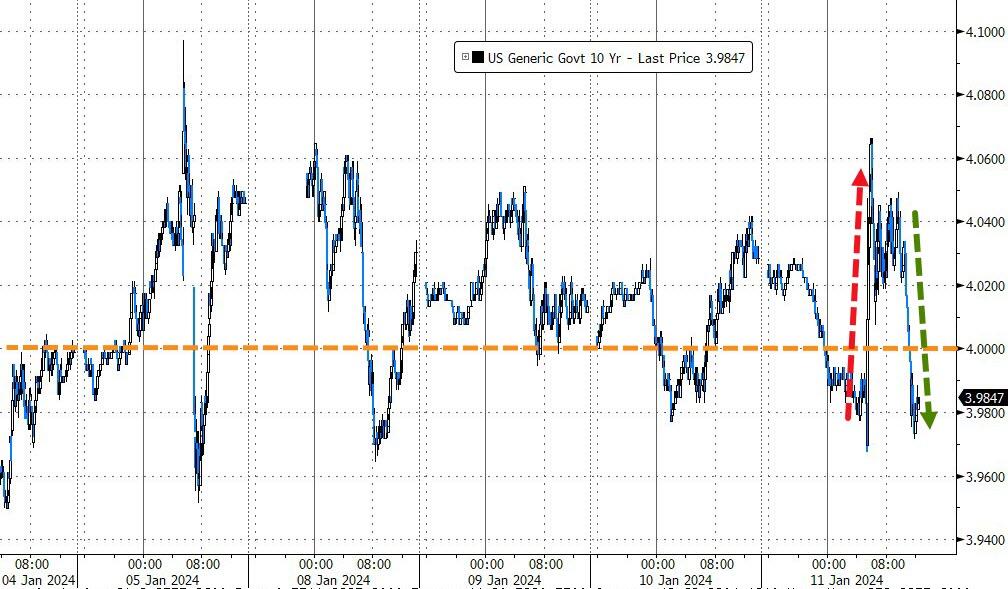
Retail sales rose 0.6% from November and 0.4% without autos. Economists were expecting 0.4% and 0.2%, respectively. The 10-year Treasury yield jumped to 4.11%, up 4 basis points from Tuesday, after Fed Governor Waller said the Fed might not ease as fast as the market wants.
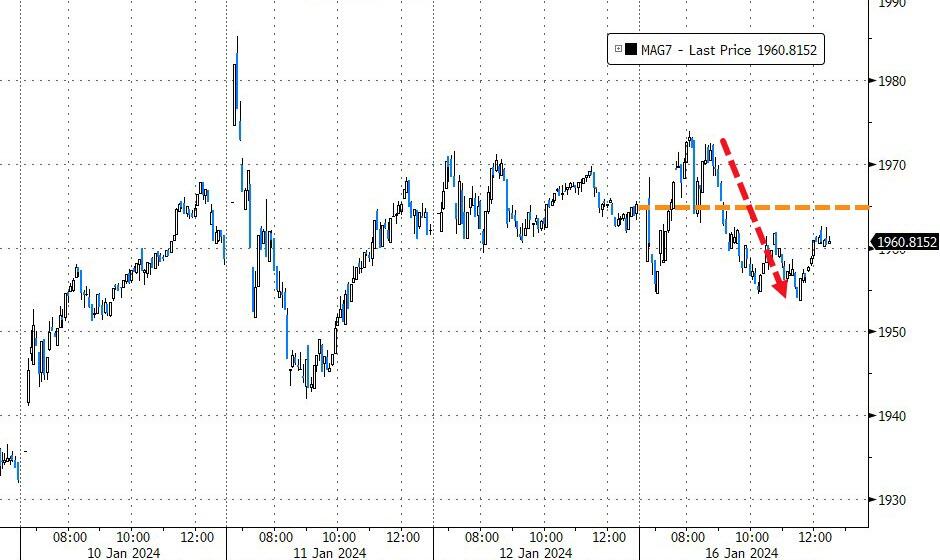
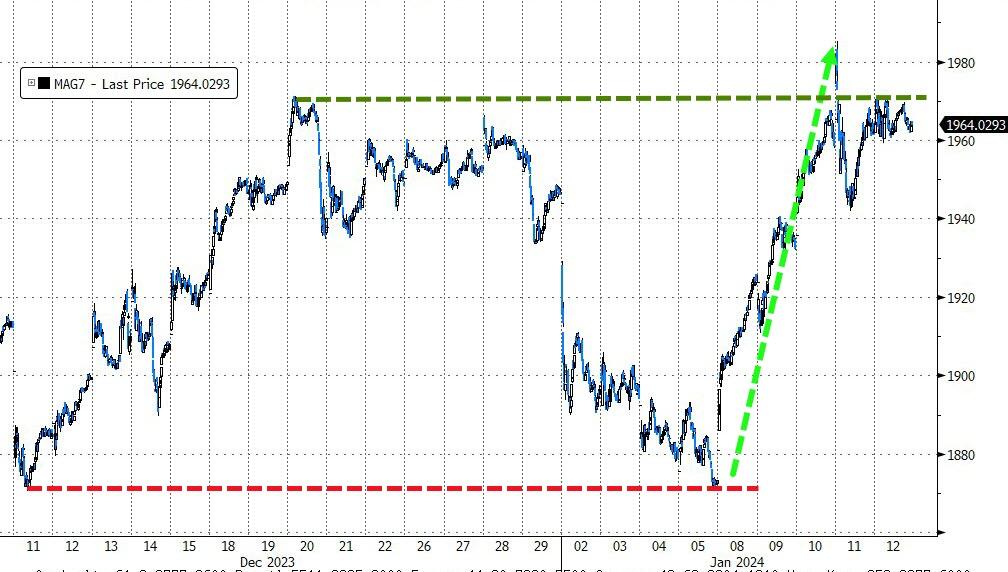
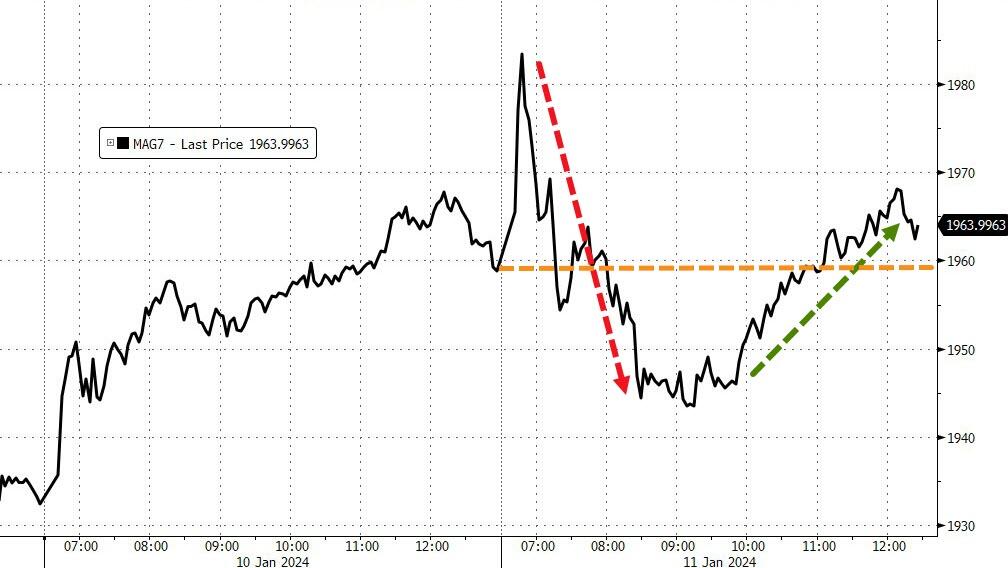
The MAG7 stocks (Microsoft, Apple, Google, Amazon, Facebook, Netflix, and Tesla) had a bad day, losing all their gains for the year. The most hated stocks also kept falling, with no sign of a rebound.
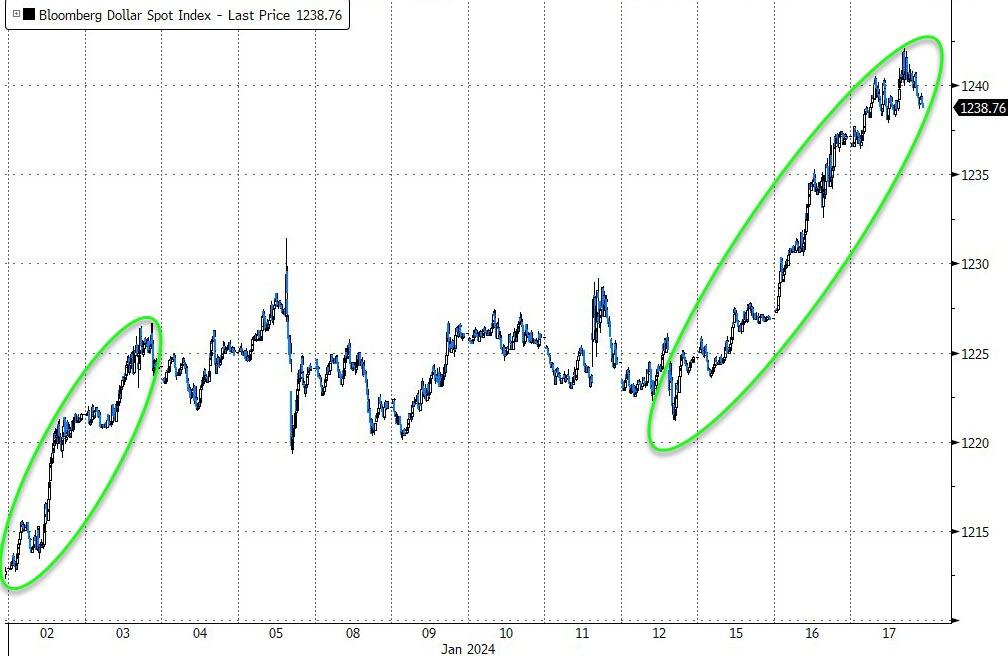
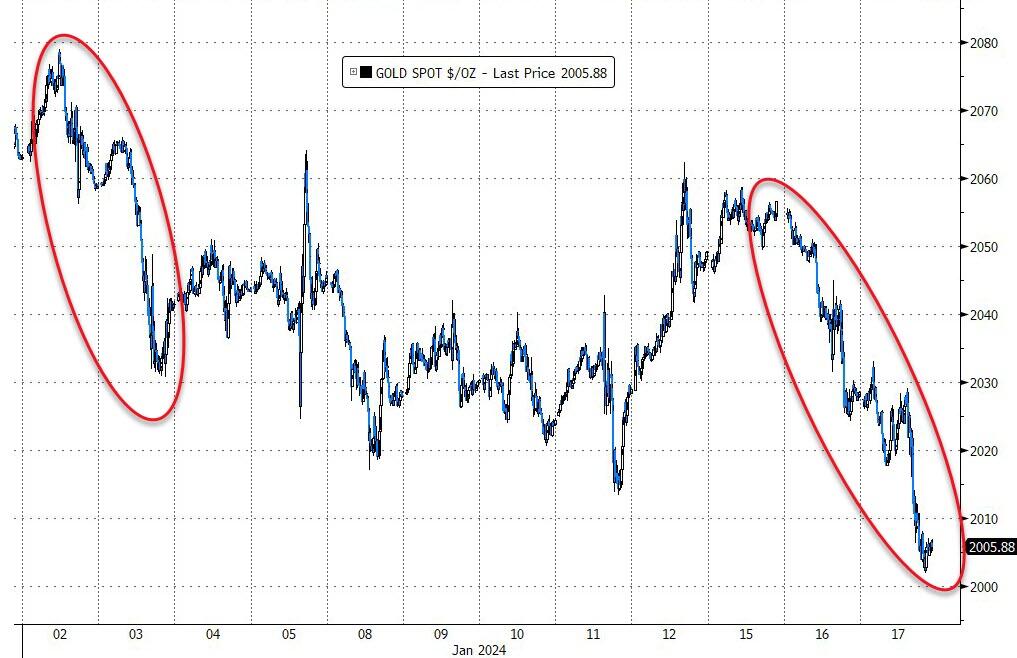
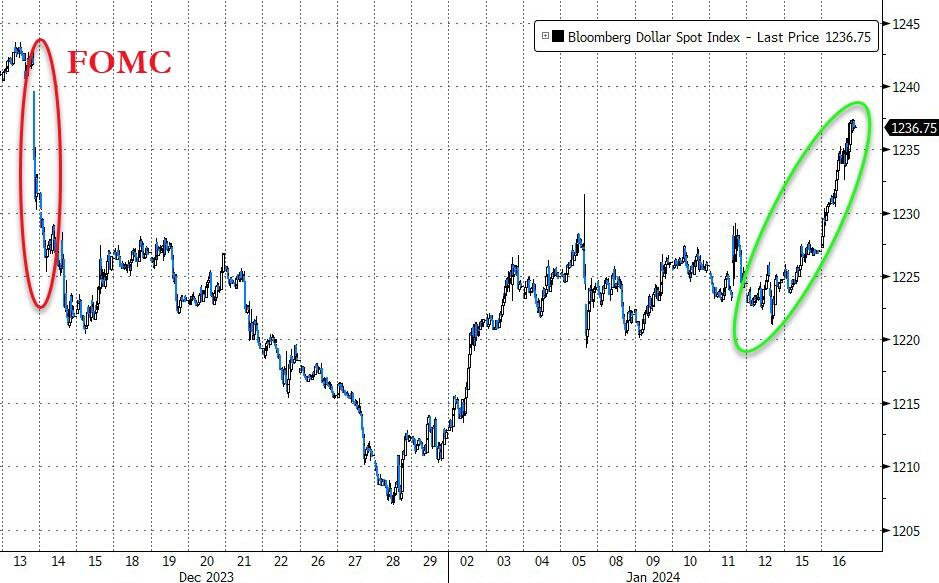
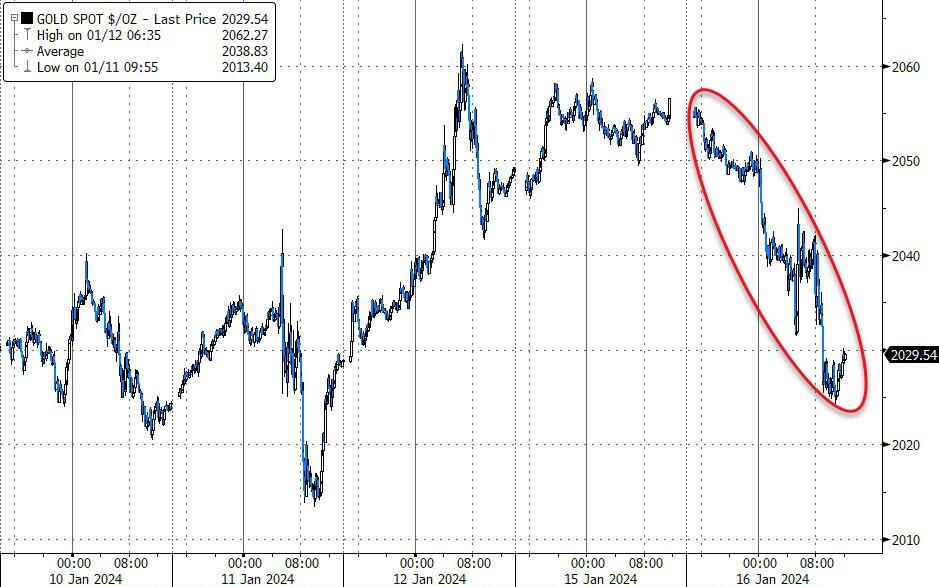
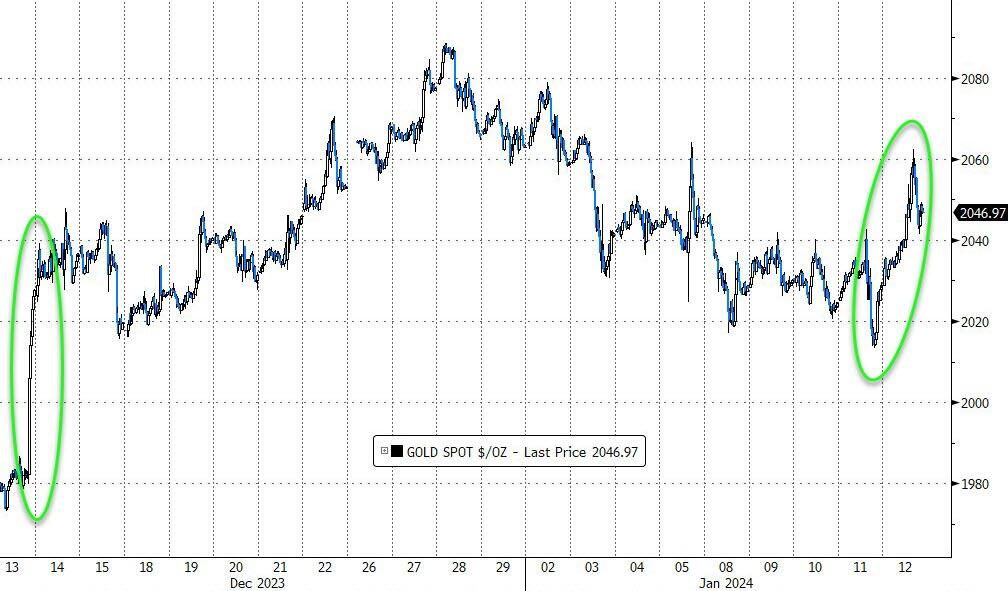
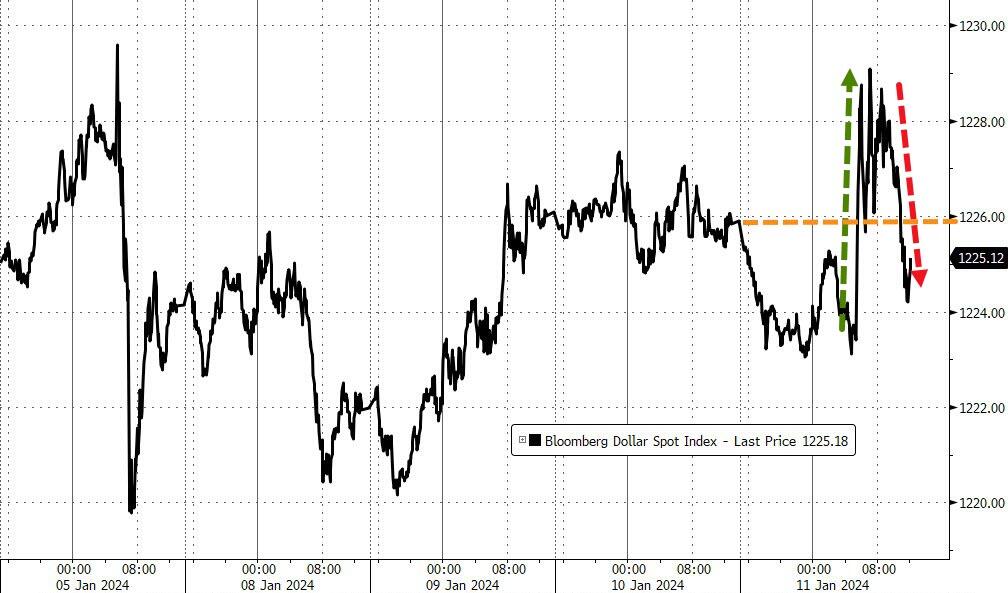
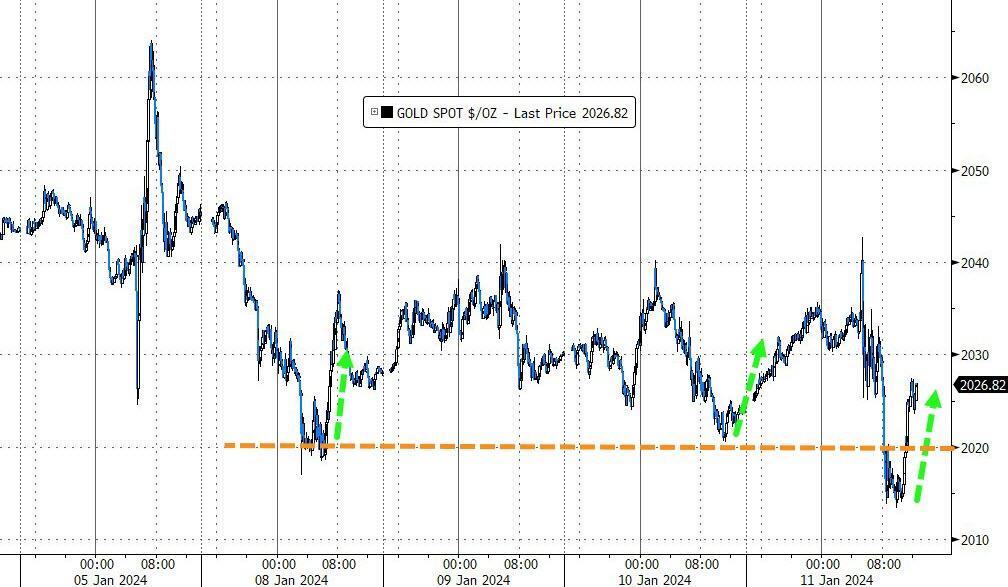
The dollar was the big winner, thanks to the higher yields. It had the best start to a year since 2015. Gold, on the other hand, suffered from the stronger dollar, and ended the day lower.
The Fed’s next move will be crucial for the market’s direction. The Fed is in a tough spot. If Powell gives the market what it wants (6 rate cuts) in this election year, inflation will go through the roof, and everyone will be mad, especially the politicians who want to keep their jobs. If he doesn’t cut, the market will be sad, and only the bears will be happy.
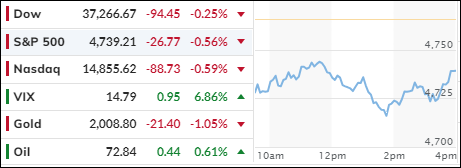
The Dow took a nosedive today, leading the market’s merry dance downwards as interest rates inched up and traders sifted through the latest earnings reports like kids at a candy store. Investors are on the edge of their seats, waiting for more data to peek into the wallet of the American consumer.
The 10-year Treasury note yield leaped like a frog, up 12 basis points to 4.071%, after Federal Reserve Governor Christopher Waller played coy in his speech, hinting that the Fed’s monetary policy might loosen up slower than a snail at a marathon, much to Wall Street’s chagrin.
Waller’s words were a juggling act of optimism and caution:
“I’m getting that warm, fuzzy feeling that we’re almost hugging that sustainable 2% PCE inflation.”
“As long as inflation doesn’t get clingy, I’m hopeful the FOMC will cut the federal funds rate target range this year.”
“When it’s time to trim rates, let’s do it with the precision of a bonsai artist.”
“With the economy flexing and inflation on a gentle descent to 2%, there’s no rush to slash rates like a Black Friday sale.”
“I’m pretty sure we’ve nailed the policy setting.”
Traders, expecting a different tune, watched their rate-cut dreams crumble like a cookie. Equities took a dive, bond yields soared, and the message was loud and clear: those six rate cuts we were daydreaming about? Might want to pinch yourself. And a March cut? Don’t bet your bottom dollar.
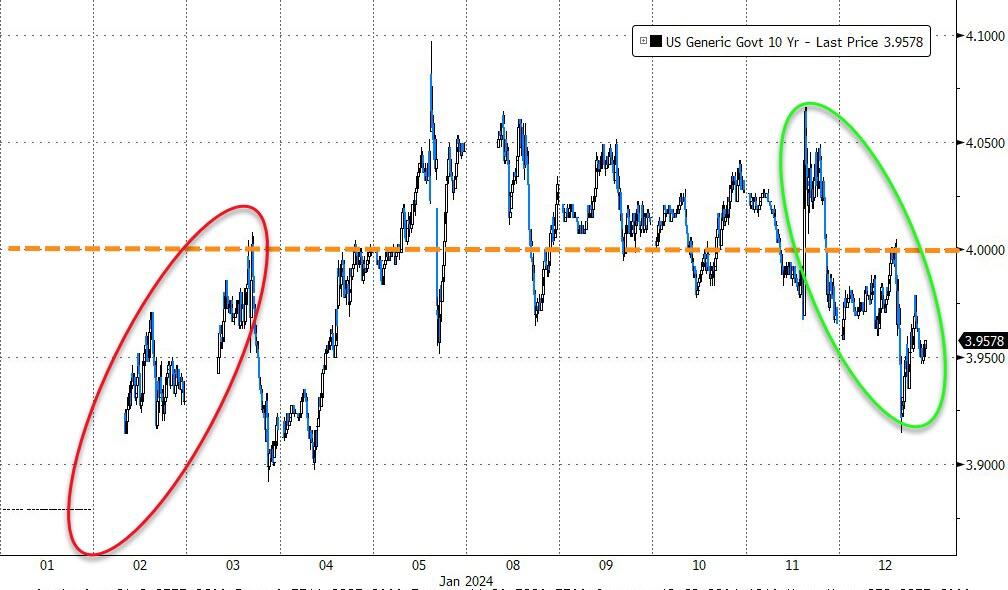
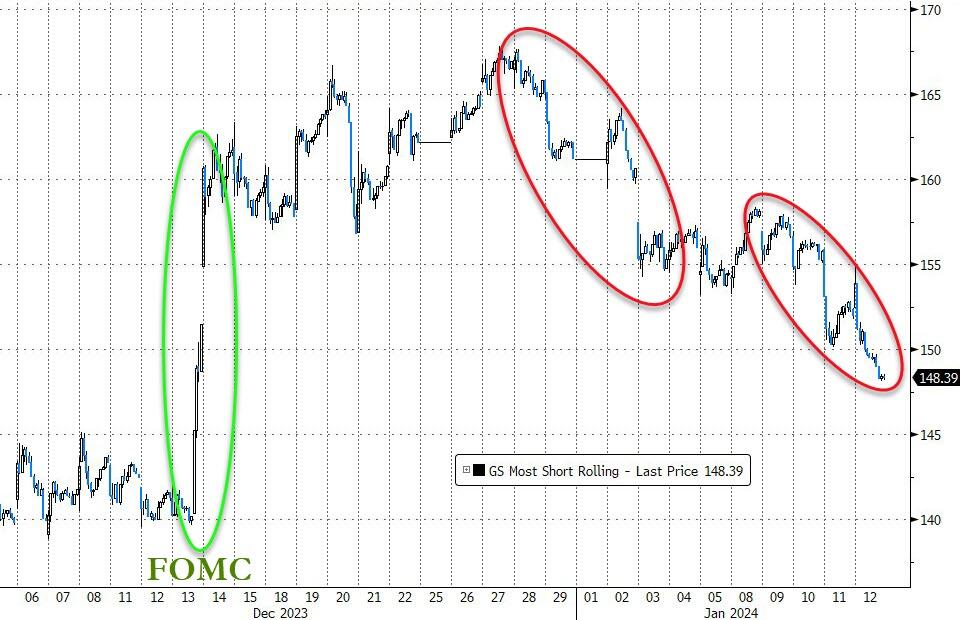
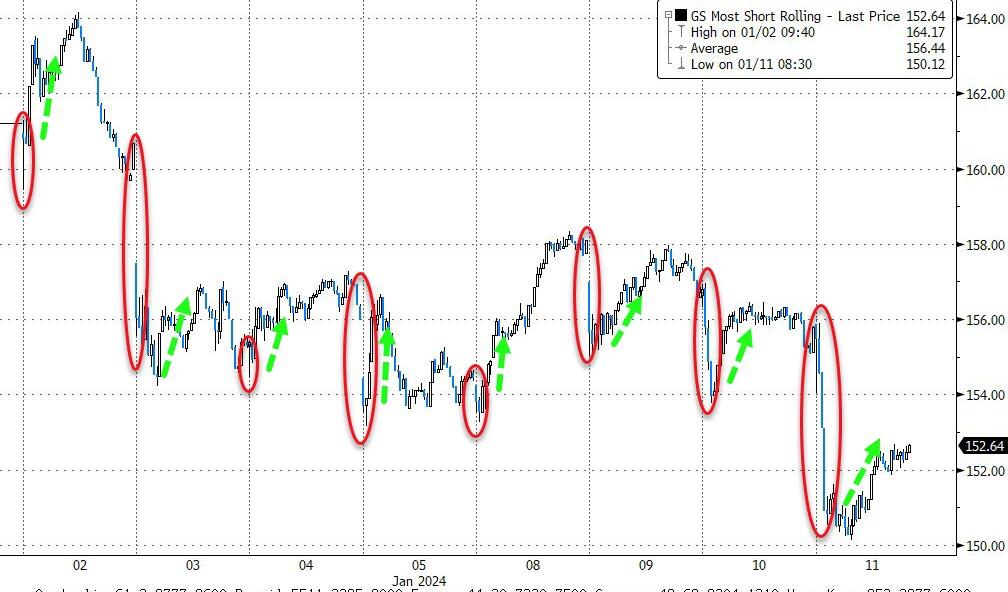
The 10-year yield strutted back above 4% and closed at its loftiest since the December Fed meeting, as financial conditions loosened up. The MAG7 stocks stood their ground, but the most shorted gave their investors some nice gains.
The dollar, riding the high-yield wave, broke free from its trading shackles, while gold took a tumble yet clung to its $2k throne.
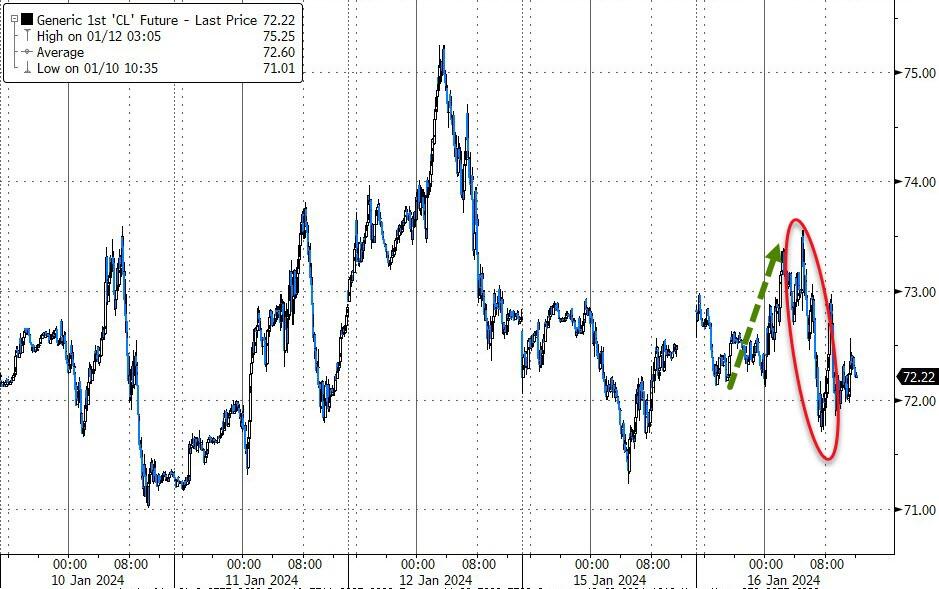
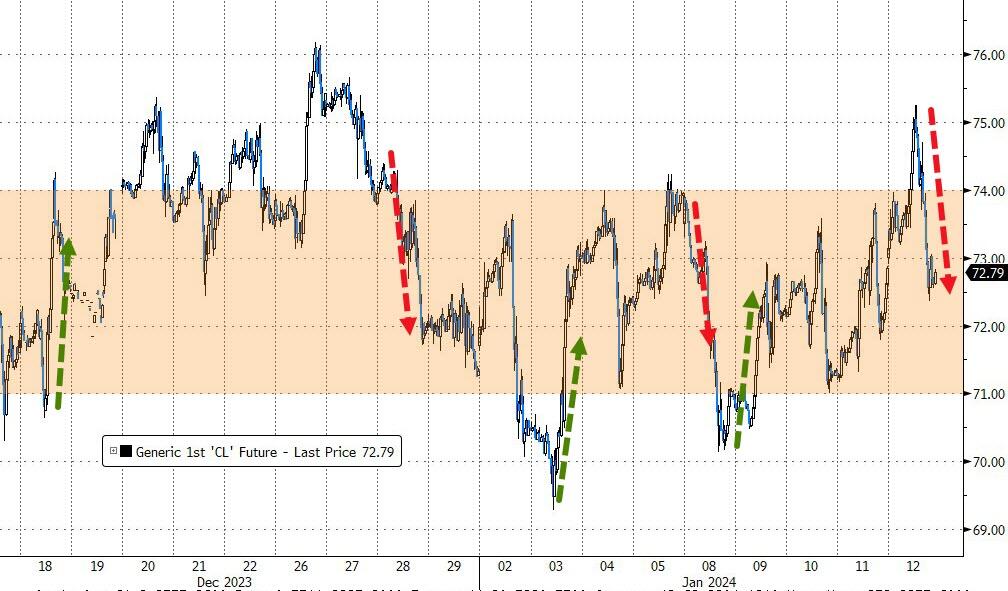
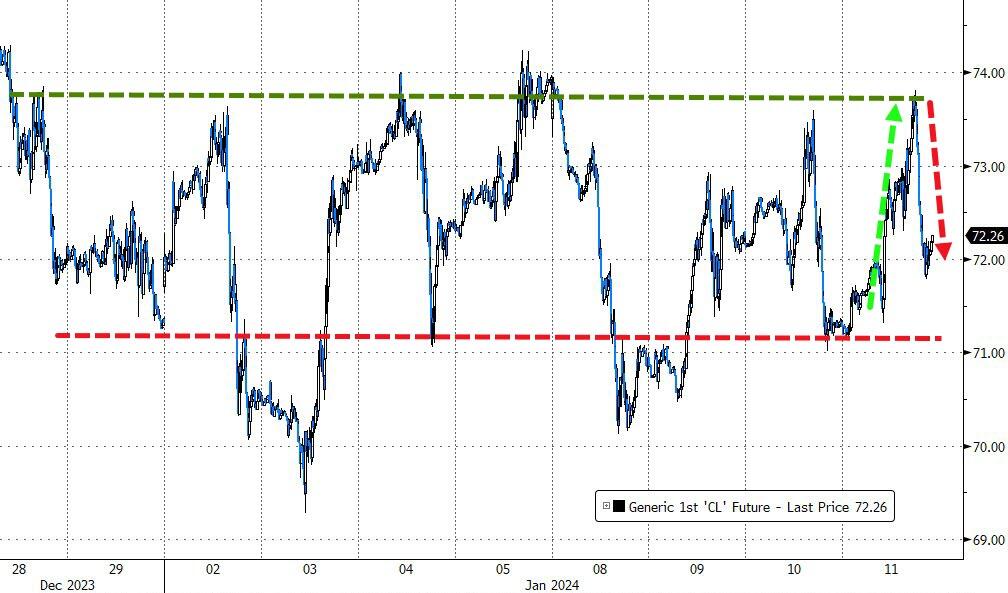
Amidst the growing drumbeats of war in the Middle East, crude oil played hopscotch before bowing out lower. But don’t hold your breath; this calm might just be the eye of the storm.
Will the market’s rollercoaster ride smooth out, or are we in for more loop-the-loops?
Do you want to know which ETFs are hot and which ones are not? Then you need my High-Volume ETF Cutline report. It tells you how close or far each of the 311 ETFs I follow is from its long-term trend line (39-week SMA). These are the ETFs that trade more than $5 million a day, so they are not some obscure funds that nobody cares about.
The report is split into two parts: The winners that are above their trend line (%M/A), and the losers that are below it. The yellow line is the line of shame that separates them. You can see how many ETFs are in each group and how they have changed since the last report (264 vs. 261 current).
UNCLE SAM’S BUDGET BONANZA: A PRELUDE TO INFLATION’S SECOND ACT?
[Chart courtesy of MarketWatch.com]
Moving the markets
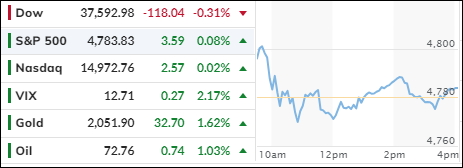
In today’s financial circus, the major stock indexes tiptoed around their opening marks, with traders juggling the lackluster first act of fourth-quarter earnings and munching on a double-feature of inflation reports. The Dow, however, decided to break ranks and march to its own drumbeat.
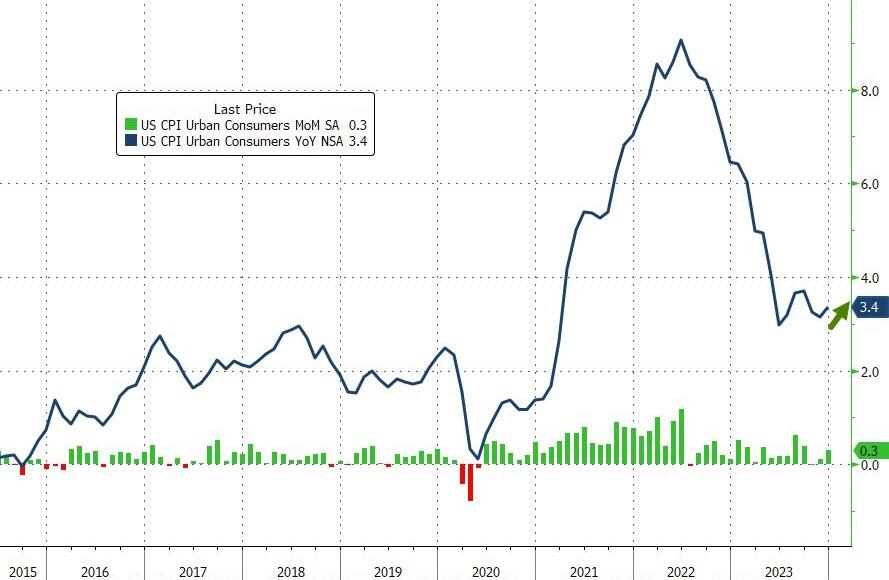
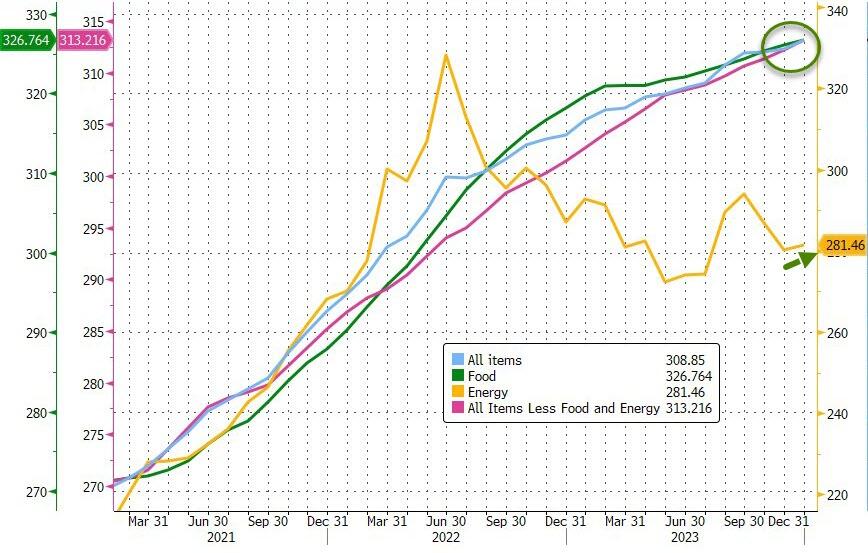
The plot thickened on Friday when wholesale prices took a surprising bow, dipping by 0.1% in December. This twist came hot on the heels of Thursday’s consumer prices saga, which sizzled a tad more than the economic fortune-tellers predicted, rising 0.3% monthly and 3.4% annually.
Market optimists, ever the cheerleaders, leaped at the PPI’s unexpected dip, waving pompoms for the notion that December’s CPI spike was just a guest appearance. They’re betting the Fed will roll out the red carpet for interest rate cuts in 2024.
In a dramatic turn, a ‘chill’ PPI has stolen the spotlight from a ‘sizzling’ CPI, sending the markets into a dovish dance, with rate-cut bets hitting the jackpot. The March rate cut odds are now strutting over 80%, likely egged on by the banking sector’s blues, which could prompt the Fed to play the rate-cut card come March. But will this be the magic trick to sidestep a banking blunder?
Bond yields took a nosedive this week, with the 10-year yield slipping under the 4% tightrope. The Nasdaq emerged as the week’s ringmaster, boasting a 3% leap, thanks to the MAG7 stocks’ stellar performance. Meanwhile, the Dow and Small Caps kept their balance, and the S&P 500 swung almost 2% higher.
The most shorted stocks took a 4% plunge, wiping away a chunk of December’s losses. Gold, the glittering star, soared in the final act, buoyed by a murky global stage and whispers of lower interest rates. Crude oil, however, stayed caged within its range despite wild fluctuations.
Peering into Uncle Sam’s wallet, we find a fiscal horror show: a $509 billion budget deficit just three months into 2024, second only to 2021’s COVID extravaganza. December’s deficit alone ballooned to $129.4 billion, dwarfing estimates and last year’s figure by over 50%.
This financial frenzy spells a sequel of money-printing madness to bankroll the spending spree. So, folks, brace yourselves—could this be a prelude to an inflation encore?
ETF Data updated through Thursday, January 11, 2024
How to use this StatSheet:
Out of the 1,800+ ETFs out there, I only pick the ones that trade over $5 million per day (HV ETFs), so you don’t get stuck with a lemon that nobody wants to buy or sell.
Trend Tracking Indexes (TTIs)
These are the main indicators that tell you when to buy or sell Domestic and International ETFs (section 1 and 2). They do that by comparing their position to their long-term M/A (Moving Average). If they cross above, and stay there, it’s a green light to buy. If they fall below, and keep going, it’s a red light to sell. And to make sure you don’t lose your shirt if things go south, I also use a 12% trailing stop loss on all positions in these categories.
All other investment areas don’t have a TTI and should be traded based on the position of each ETF relative to its own trend line (%M/A). That’s why I call them “Selective Buy.” In other words, if an ETF goes above its own trend line, you can buy it. But don’t forget to use a trailing sell stop of 12%, or less if you’re feeling nervous.
If some of these words sound like Greek to you, please check out the Glossary of Terms and new subscriber information in section 9.
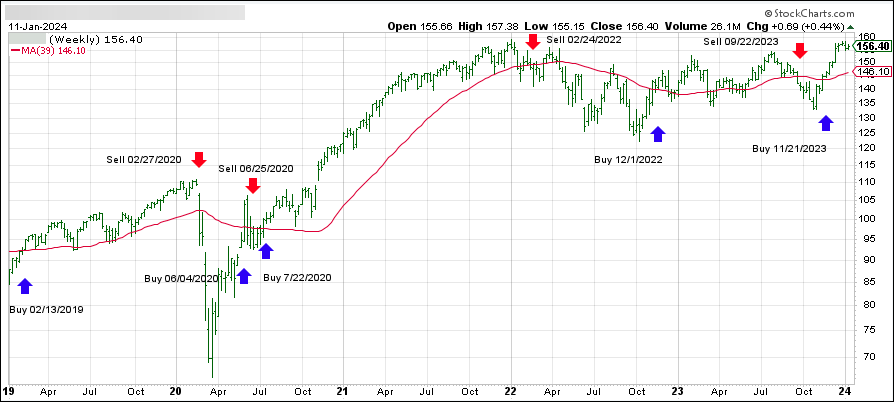
DOMESTIC EQUITY ETFs: BUY— since 11/21/2023
Click on chart to enlarge
This is our main compass, the Domestic Trend Tracking Index (TTI-green line in the above chart). It has broken above its long-term trend line (red) by +7.31% and is in “Buy” mode as posted.
The major indexes had a bumpy ride on Thursday, as they plunged after the opening bell, then bounced back, and ended the day flat.
The trigger for the initial sell-off was the latest inflation report, which showed that consumer prices rose more than expected in December, reaching the highest annual rate in 13 years.
The CPI report revealed a 0.3% increase in consumer prices for the month, pushing the annual rate to 3.4%. Economists had forecasted a 0.2% increase in December and a 3.2% annual rate.
The core CPI, which excludes food and energy prices, matched expectations, but still indicated that inflation pressures were persistent, though easing. The report also showed that a key measure of inflation, the core CPI services ex-shelter (or supercore), rose 0.4% month-over-month and 4.09% year-over-year.
ZeroHedge summarized the report with these bullet points:
• Headline costs at record highs
• Core costs at record highs
• Food costs at record highs
• Fuel costs on the rise again
Bond yields and the markets shrugged off the inflation data, and traders kept hoping for a slowdown in price increases this year, despite the evidence to the contrary.
The report also suggested that the Fed may be less inclined to cut interest rates further, or even tighten its monetary policy, to curb inflation.
This could create more volatility in the markets, as the economic recovery remains uncertain, and the macro-economic data remains murky.
The most shorted stocks dropped today, while the late-session rally did not damage the downtrend. The MAG7 stocks had a wild ride and finished the day unchanged.
Bond yields spiked at first but fell later in the day, helping stocks erase their losses. The 10-year yield hovered around 4% and closed below it. The dollar fluctuated and weakened in the end. Gold and crude oil faced some volatility as well but managed to end the day slightly higher.
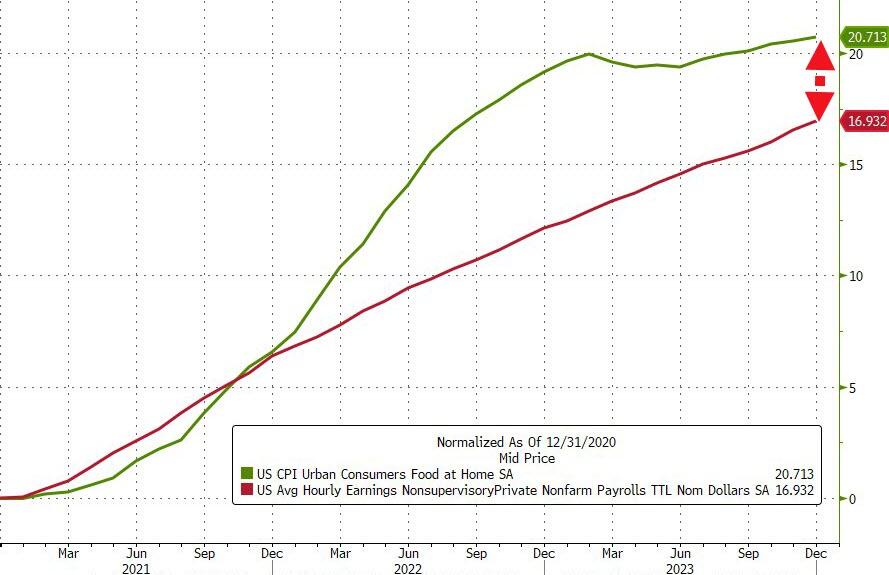
Wall Street tried to make the CPI report look better than it was, but the reality is that things, especially food, are getting more expensive. And sadly, wages are not keeping up, as this chart shows.
Will the markets continue to ignore inflation, or will they wake up and smell the coffee?
Continue reading…
4. Current “Buy” Cycles (effective 11/21/2023)
Our Trend Tracking Indexes (TTIs) have both crossed their trend lines with enough strength to trigger new “Buy” signals. That means, Tuesday, 11/21/2023, was the official date for these signals.
If you want to follow our strategy, you should first decide how much you want to invest based on your risk tolerance (percentage of allocation). Then, you should check my Thursday StatSheet and Saturday’s “ETFs on the Cutline” report for suitable ETFs to buy.
3. Trend Tracking Indexes (TTIs)
The major indexes showed no clear direction after the CPI report revealed higher than expected inflation. The market recovered from an initial drop and ended the day with little change.
Our TTIs declined a bit, but they still indicate a positive outlook for the market.
This is how we closed 1/11/2024:
Domestic TTI: +7.31% above its M/A (prior close +7.62%)—Buy signal effective 11/21/2023.
International TTI: +6.46% above its M/A (prior close +6.62%)—Buy signal effective 11/21/2023.
All linked charts above are courtesy of Bloomberg via ZeroHedge.
———————————————————-
WOULD YOU LIKE TO HAVE YOUR INVESTMENTS PROFESSIONALLY MANAGED?
Do you have the time to follow our investment plans yourself? If you are a busy professional who would like to have his portfolio managed using our methodology, please contact me directly to get more details.


