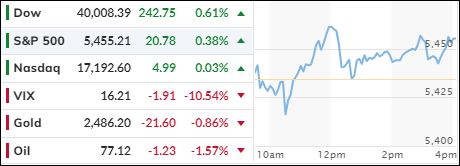
Equities scored moderate gains, led by the Dow, as the much-anticipated Consumer Price Index (CPI) fell below the 3% mark, coming in at 2.9%, its lowest reading since 2021. Month-over-month prices increased by 0.2%, aligning with expectations, as did core inflation, which excludes food and energy.
This follows a better-than-expected Producer Price Index (PPI) report, which boosted stocks during yesterday’s market surge. Traders believe these figures have increased the likelihood of the Federal Reserve cutting rates at their next meeting in September.
Speculation is now rife about whether the Fed will cut rates by 25 or 50 basis points. Future economic data will be crucial, as weaker data could support a change in Fed policy.
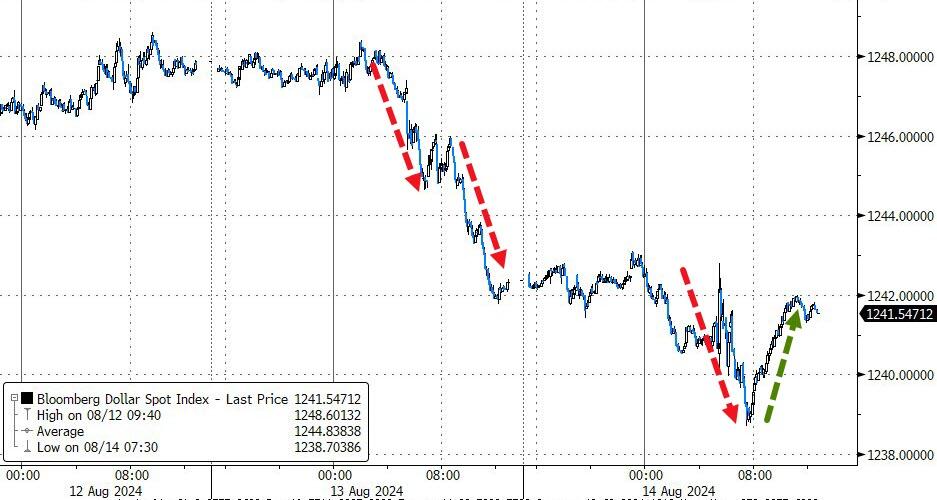
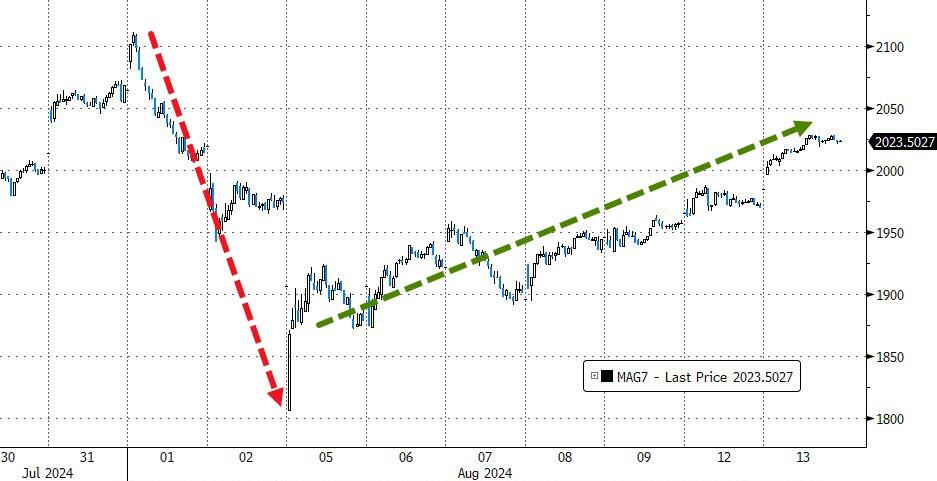
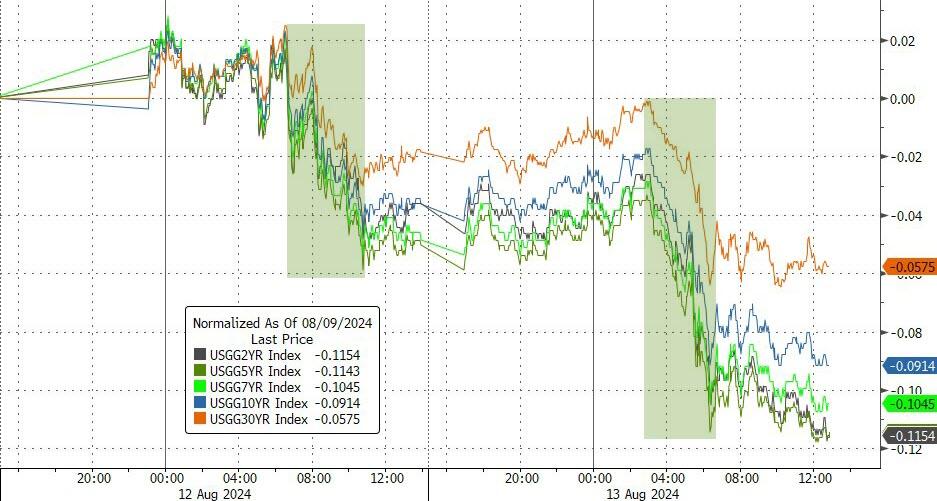
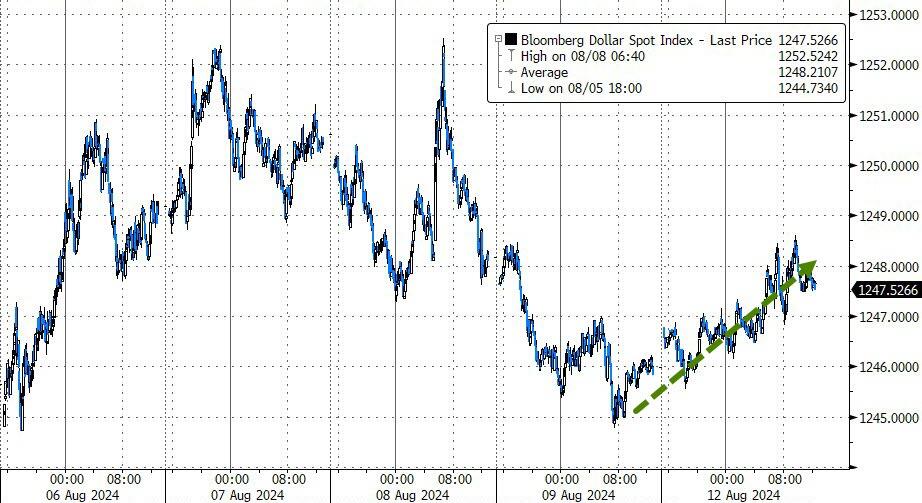
The session was somewhat perplexing: Small Caps declined, the Dow rose, the Nasdaq remained unchanged, bond yields were mixed, and the dollar initially slid before staging a comeback. The Mag7 basket rallied, but commodities dropped.
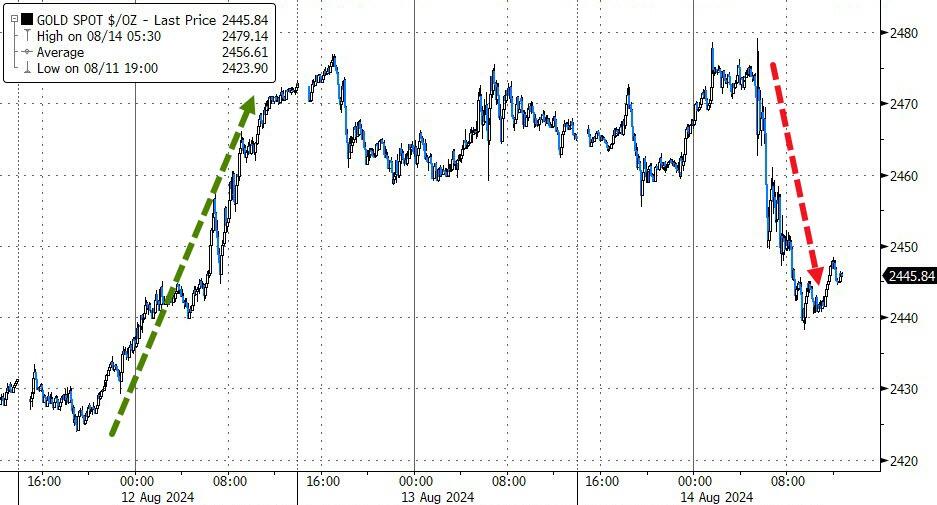
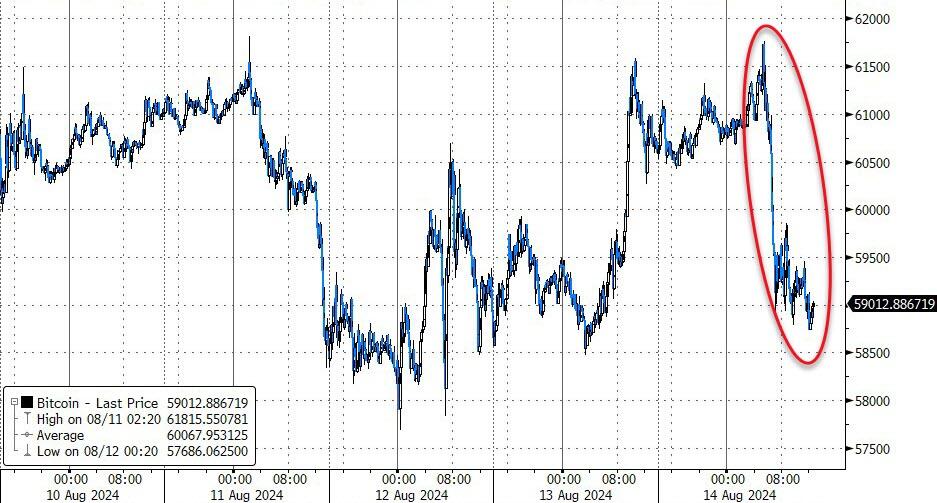
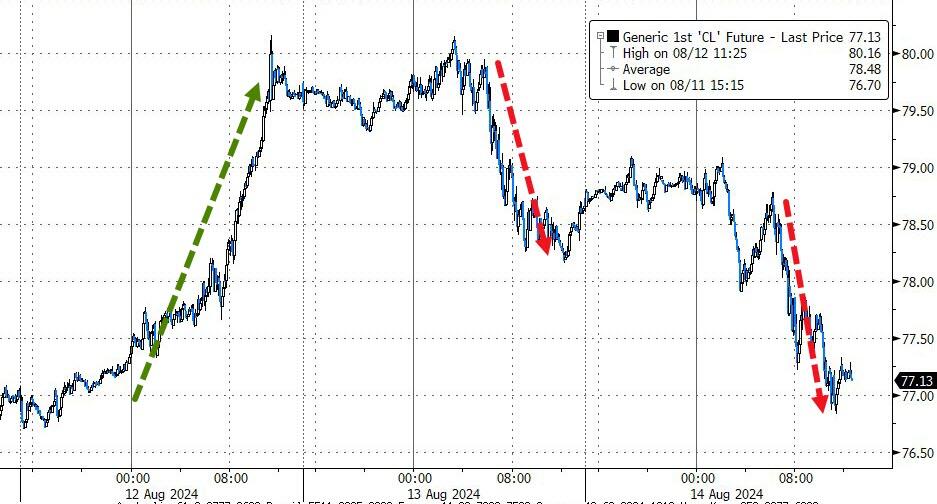
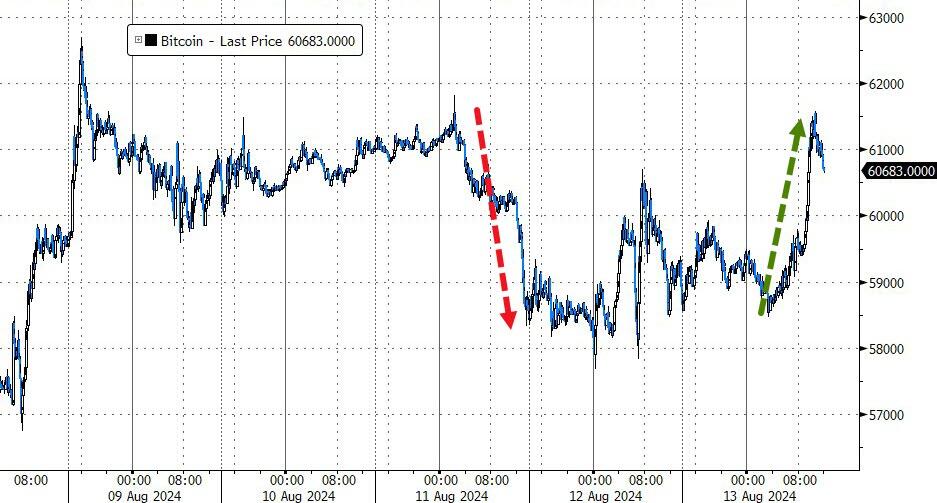
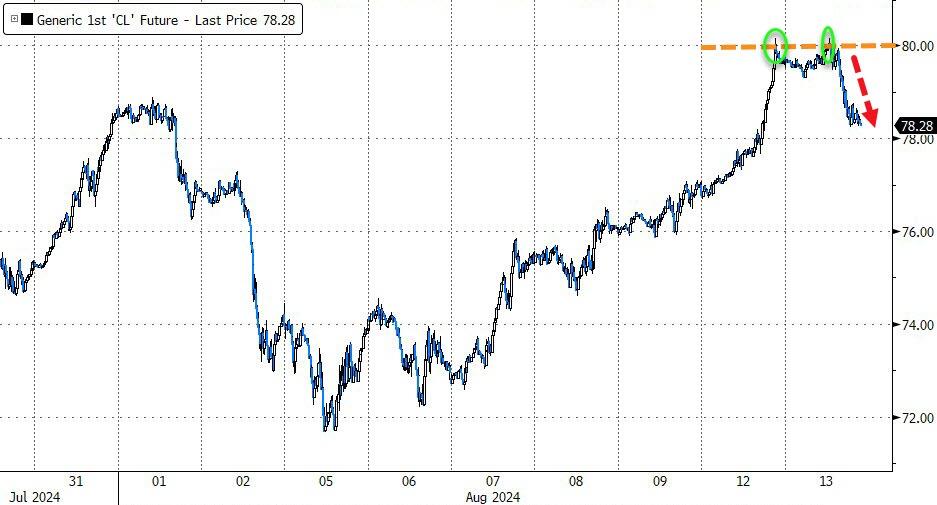
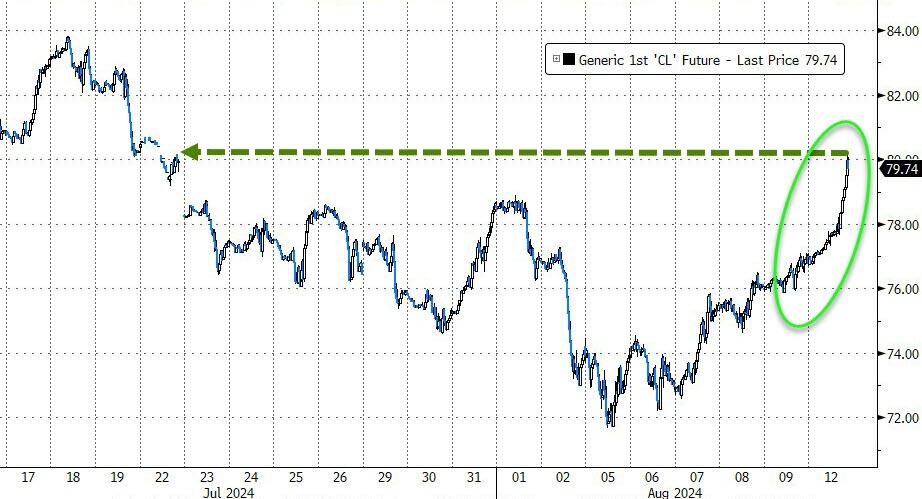
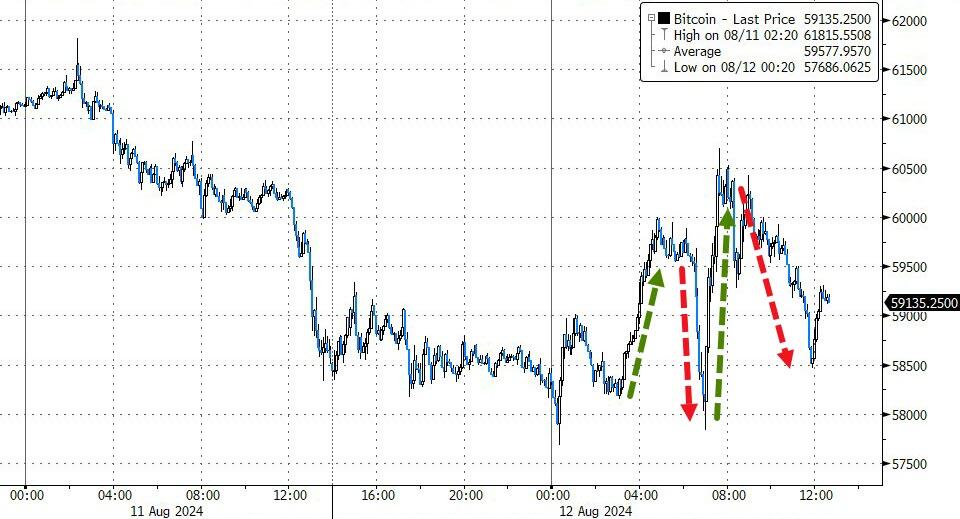
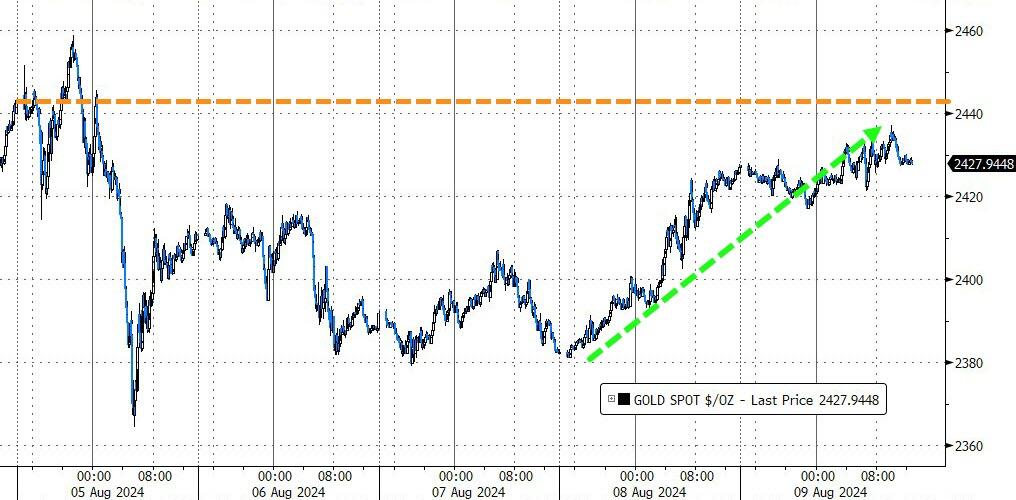
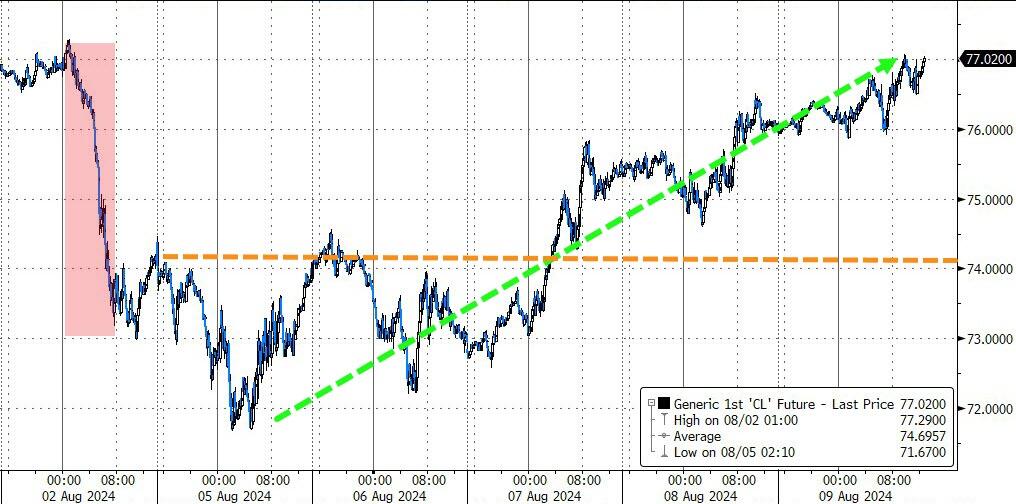
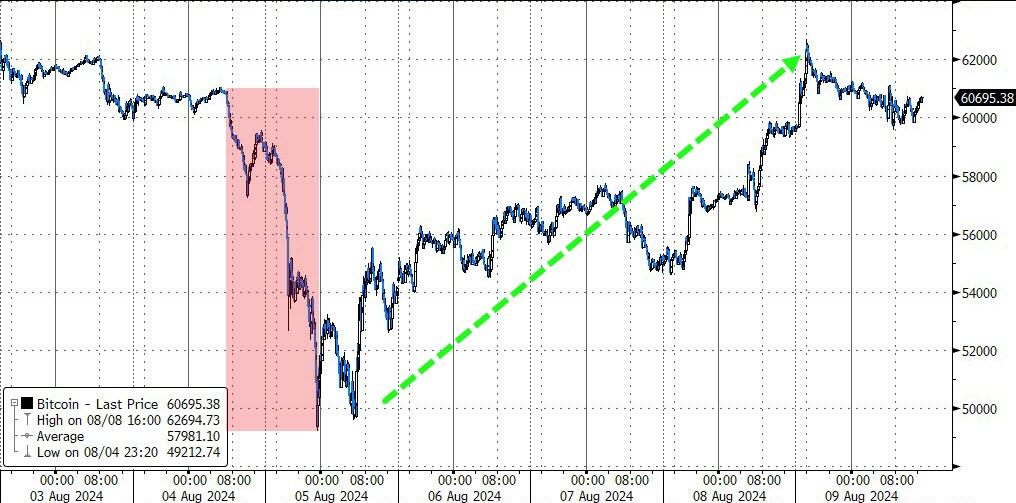
Gold and Bitcoin both declined, with Bitcoin affected by news that the U.S. government may be selling some of its holdings. Crude oil also followed a downward trend but found support at the $77 level.
Traders are now focusing on tomorrow’s major event—the release of retail sales data, which has the potential to move markets in either direction.
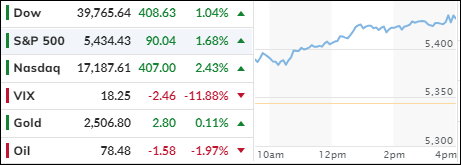
The major indexes experienced an upward climb as the Producer Price Index (PPI) increased by only 0.1% last month, compared to the anticipated 0.2% rise for July, which would have matched the previous month’s increase.
This modest rise in PPI provided hope for those advocating for a dovish shift in Federal Reserve policy. However, it also raised concerns about potential negative impacts on corporate profitability and, consequently, stock prices.
Despite these concerns, traders remained optimistic ahead of the more significant Consumer Price Index (CPI) report due tomorrow, driving the broad market higher. The CPI is expected to show a 0.2% increase, following a 0.1% decline in June. An outcome in line with expectations could bring temporary stability to the markets after last week’s volatility.
Hedge funds played a crucial role in the market’s recovery by buying into the selloff, helping major indexes recover from significant losses and reducing downside risk for the time being. Nevertheless, I expect volatility to persist due to the uncertain outlook of the US economy and the upcoming Presidential elections.
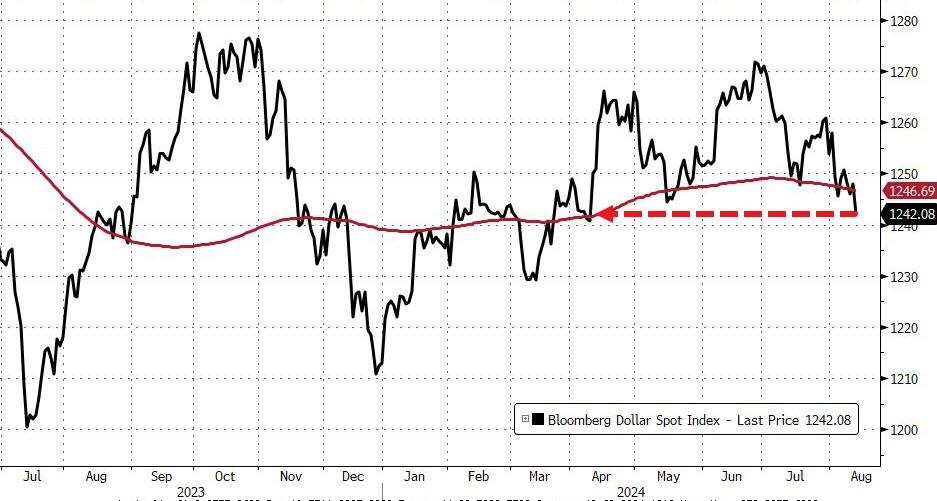
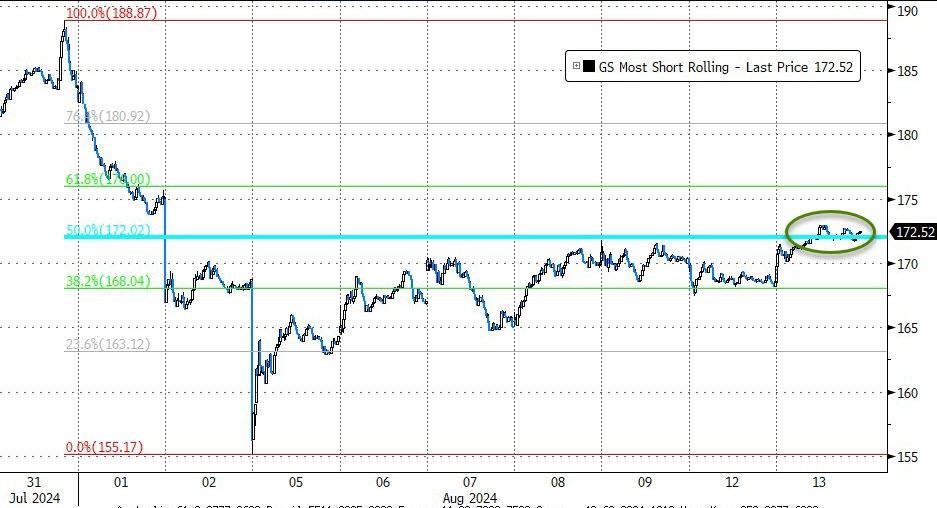
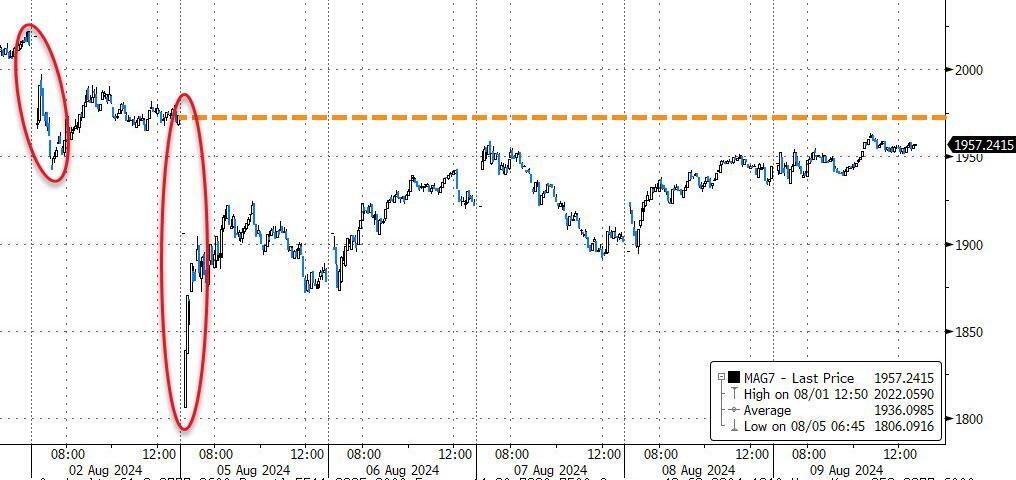
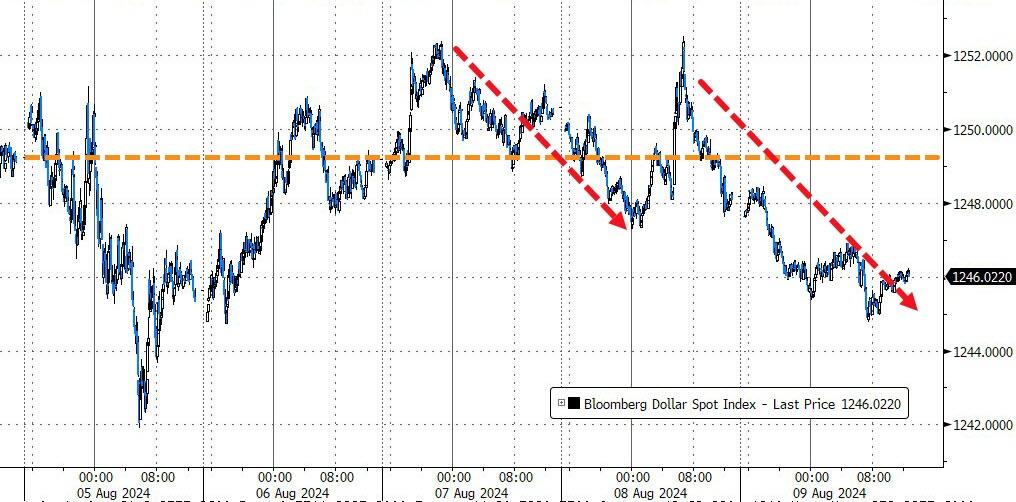
The dollar index fell to its lowest level in four months, while the MAG 7 stocks continued their recovery, aided by another short squeeze that has now erased approximately 50% of last week’s decline.
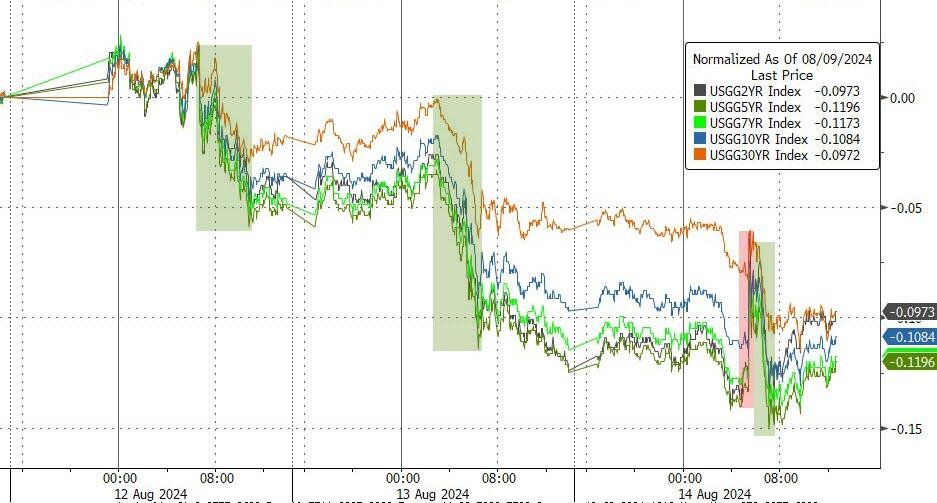
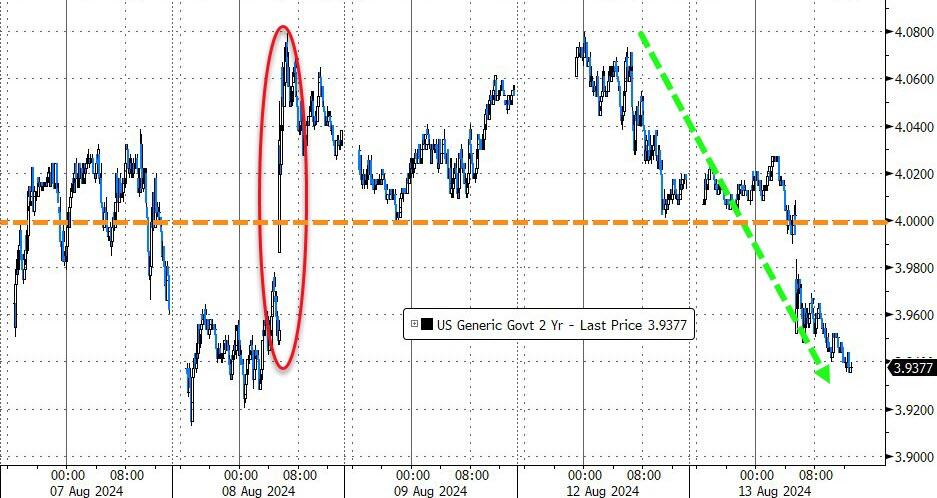
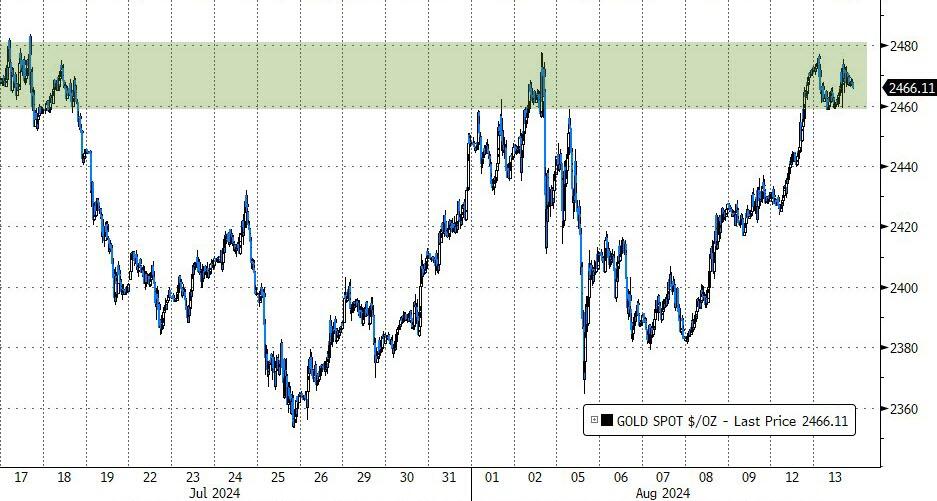
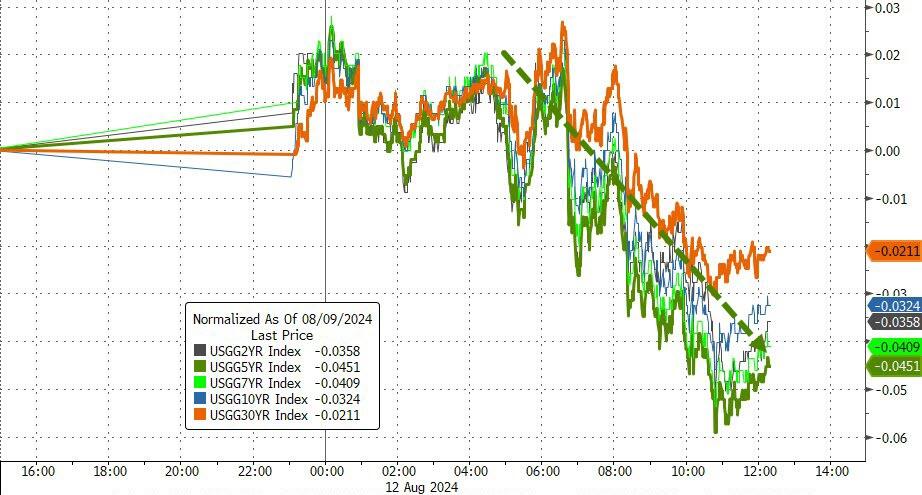
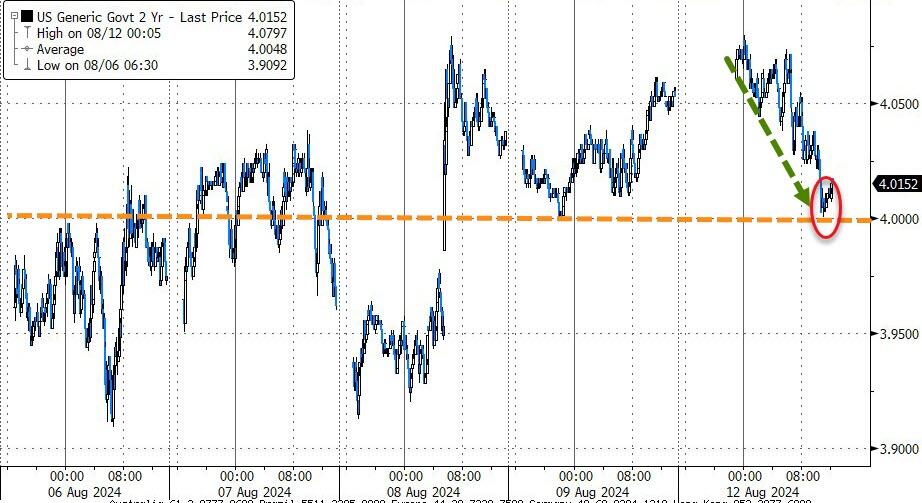
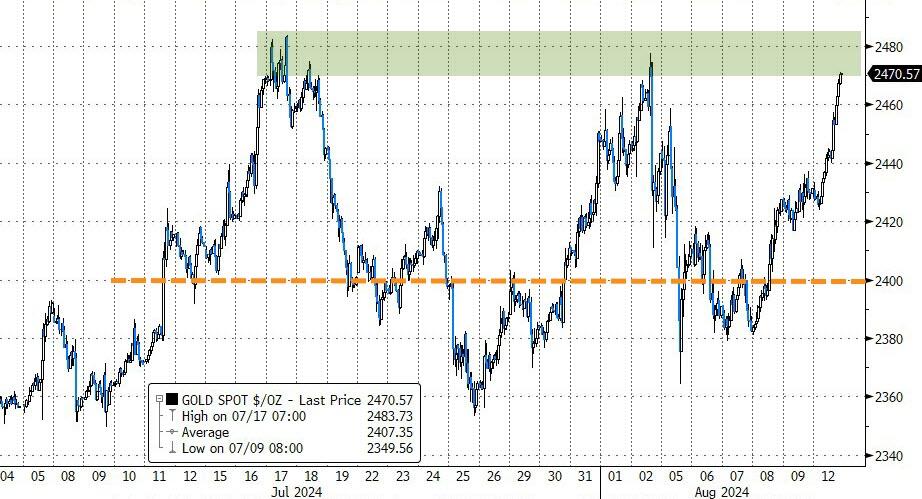
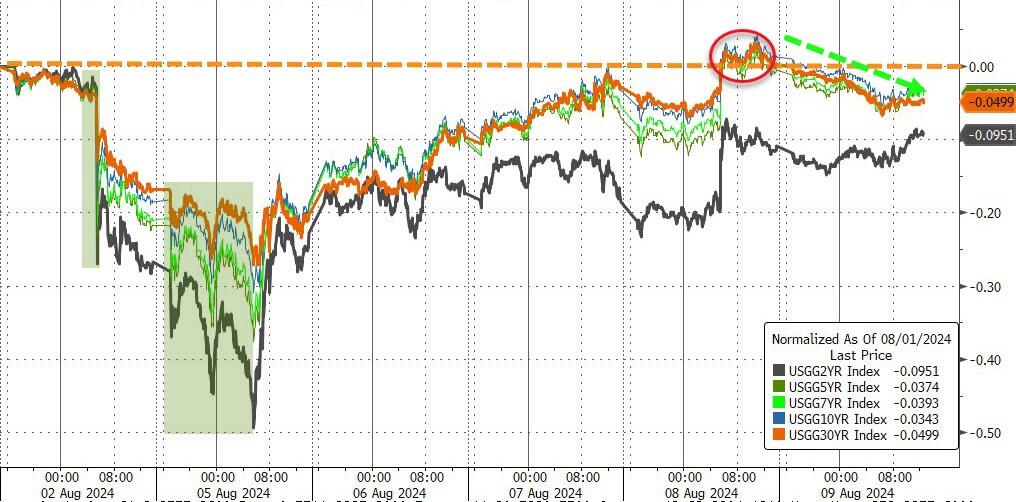
Bond yields also slipped, with the 2-year yield dropping below the 4% mark as rate-cut expectations increased. Bitcoin regained its footing, reaching the $61.5k price point, while crude oil prices dipped. Gold showed moderate gains and remained near its record highs.
Traders are eagerly awaiting tomorrow’s CPI report, but equally important and potentially market-moving will be Nvidia’s earnings report.
Continue reading…
2. Current “Buy” Cycles (effective 11/21/2023)
Our Trend Tracking Indexes (TTIs) have both crossed their trend lines with enough strength to trigger new “Buy” signals. That means, Tuesday, 11/21/2023, was the official date for these signals.
If you want to follow our strategy, you should first decide how much you want to invest based on your risk tolerance (percentage of allocation). Then, you should check my Thursday StatSheet and Saturday’s “ETFs on the Cutline” report for suitable ETFs to buy.
3. Trend Tracking Indexes (TTIs)
The session began on a positive note, thanks to a Producer Price Index (PPI) report that exceeded expectations. This optimistic data set the stage for bullish market sentiment, propelling the market upwards.
The rally was widespread, and our TTIs reflected this momentum, demonstrating a solid advance across the board.
This is how we closed 08/13/2024:
Domestic TTI: +4.42% above its M/A (prior close +3.24%)—Buy signal effective 11/21/2023.
International TTI: +3.53% below its M/A (prior close +2.18%)—Buy signal effective 11/21/2023.
All linked charts above are courtesy of Bloomberg via ZeroHedge.
———————————————————-
WOULD YOU LIKE TO HAVE YOUR INVESTMENTS PROFESSIONALLY MANAGED?
Do you have the time to follow our investment plans yourself? If you are a busy professional who would like to have his portfolio managed using our methodology, please contact me directly to get more details.
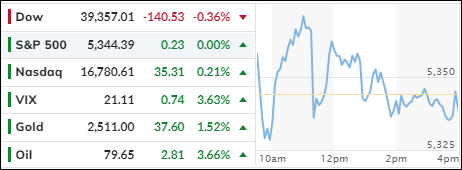
Ahead of key inflation data points, the markets fluctuated but maintained a somewhat bullish sentiment. The Dow showed the most weakness, lagging the S&P 500 and Nasdaq. Nvidia’s 2% surge helped the Nasdaq take the lead.
Wednesday’s consumer price index (CPI) report for July will be crucial. Any improvement could raise hopes that the Federal Reserve might soften its interest rate policy in their September meeting. Conversely, a worsening CPI could have a similar negative impact to the recent weak payrolls report, which sent the markets into a tailspin.
Despite the major indexes ending last week on a down note, a few rebounds minimized losses. However, concerns about an economic slowdown persist, as indicated by various metrics. This suggests that we have not seen the end of the market’s turbulent swings. Relief rallies will only be possible if economic data holds up—and that’s a big if.
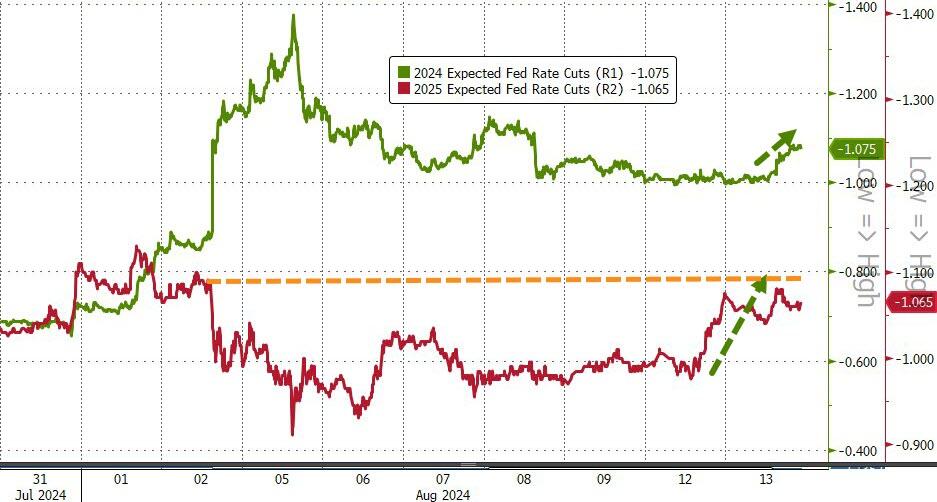
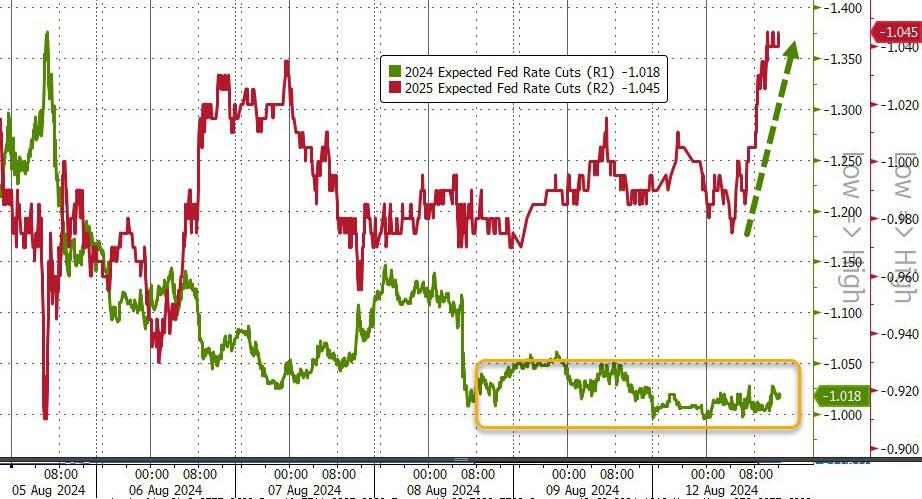
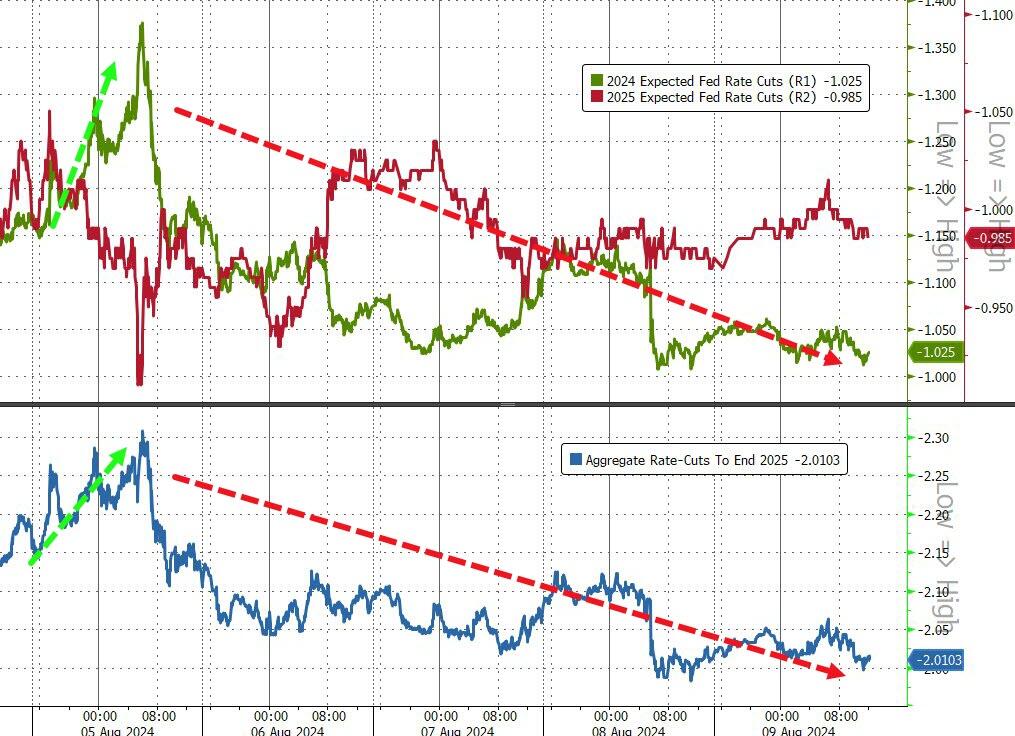
The S&P 500 experienced wild swings despite stable bond yields, which slipped throughout the session. The 2-year bond found support at the 4% level. Rate-cut expectations rose for 2024 but remained flat for 2025.
Gold, on the other hand, soared towards record highs, while crude oil followed suit due to increased tensions in the Middle East. Commodities advanced along with the dollar, but Bitcoin was volatile, fluctuating between $58,000 and $60,000.
With the Producer Price Index (PPI) due tomorrow and the CPI on Wednesday, today’s calm session may come to an end if these numbers deviate from expectations.
Do you want to know which ETFs are hot and which ones are not? Then you need my High-Volume ETF Cutline report. It tells you how close or far each of the 311 ETFs I follow is from its long-term trend line (39-week SMA). These are the ETFs that trade more than $5 million a day, so they are not some obscure funds that nobody cares about.
The report is split into two parts: The winners that are above their trend line (%M/A), and the losers that are below it. The yellow line is the line of shame that separates them. You can see how many ETFs are in each group and how they have changed since the last report (239 vs. 245 current).
INVESTOR VOLATILITY: EQUITIES UNLOADED AS MONEY MARKET ASSETS HIT RECORD HIGH
[Chart courtesy of MarketWatch.com]
Moving the market
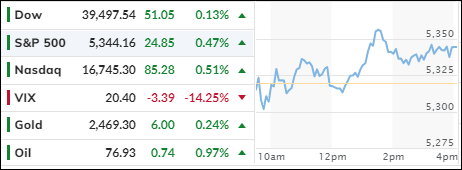
After yesterday’s strong comeback session, upward momentum slowed, but traders and algorithms continued to push the indexes higher, erasing most losses from earlier in the week.
This recovery followed Monday’s steep global sell-off, triggered by three key events: last Friday’s disappointing jobs data, uncertainty about the Fed’s anticipated rate-cutting timeline, and the unwinding of the Japanese yen carry trade.
Despite these efforts, the major indexes remain below last Friday’s close, though by a much smaller margin than a few days ago. Consequently, the S&P 500 and the Nasdaq have now recorded their fourth consecutive losing week.
Historically, equities have benefited from the “bad news is good news” scenario, where negative economic news increased the likelihood of the Fed loosening its grip on rates. However, this dynamic seems to have shifted, as the economy has weakened, and bad news now negatively impacts the markets. It appears that positive news is now necessary for equities to move higher.
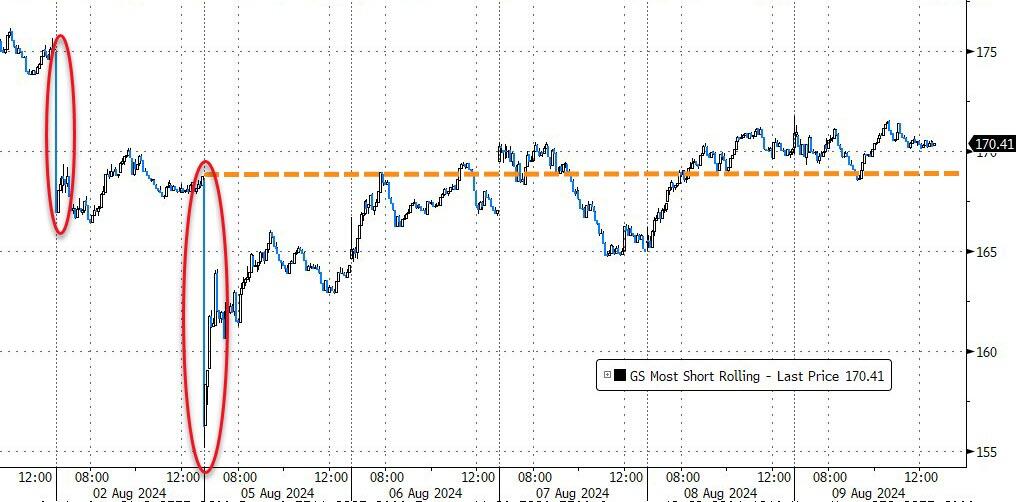
The most shorted stocks were squeezed higher after Monday’s collapse, while the MAG7 basket, after dropping 8%, entered recovery mode but did not reach the breakeven point. Bond yields fluctuated but ended higher, rate-cut expectations fell after Monday’s surge, and the dollar slipped.
Gold rebounded over the last two days, recapturing its $2,400 level but closed slightly lower for the week. Oil prices dipped and then rebounded to their $77 level from a low of $72, while Bitcoin experienced a volatile week, initially plunging but then recovering towards the $62k level.
This volatility clearly took a toll on investors, who unloaded equities and sent total money market assets to a new record high. In the current economic environment, taking some chips off the table seems wise.
However, we’ll have to wait and see if the adage “he who panics first, panics best” will hold true once again.
Out of the 1,800+ ETFs out there, I only pick the ones that trade over $5 million per day (HV ETFs), so you don’t get stuck with a lemon that nobody wants to buy or sell.
Trend Tracking Indexes (TTIs)
These are the main indicators that tell you when to buy or sell Domestic and International ETFs (section 1 and 2). They do that by comparing their position to their long-term M/A (Moving Average). If they cross above, and stay there, it’s a green light to buy. If they fall below, and keep going, it’s a red light to sell. And to make sure you don’t lose your shirt if things go south, I also use a 12% trailing stop loss on all positions in these categories.
All other investment areas don’t have a TTI and should be traded based on the position of each ETF relative to its own trend line (%M/A). That’s why I call them “Selective Buy.” In other words, if an ETF goes above its own trend line, you can buy it. But don’t forget to use a trailing sell stop of 12%, or less if you’re feeling nervous.
If some of these words sound like Greek to you, please check out the Glossary of Terms and new subscriber information in section 9.
DOMESTIC EQUITY ETFs: BUY— since 11/21/2023
Click on chart to enlarge
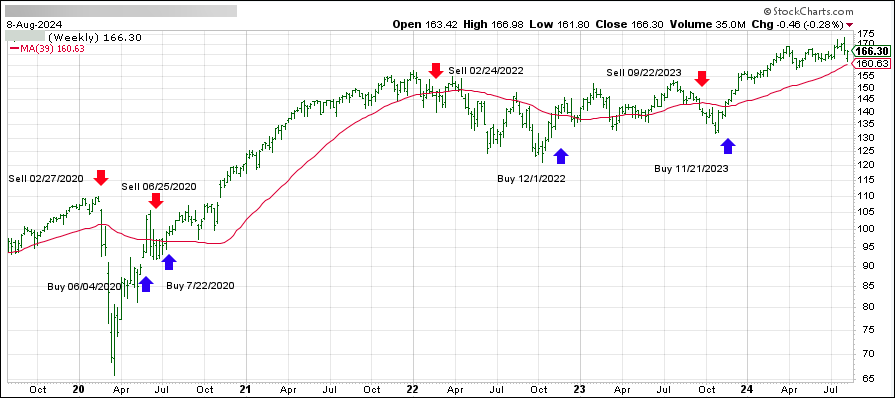
This is our main compass, the Domestic Trend Tracking Index (TTI-green line in the above chart). It has broken above its long-term trend line (red) by +3.56% and is in “Buy” mode as posted.