
- Moving the market
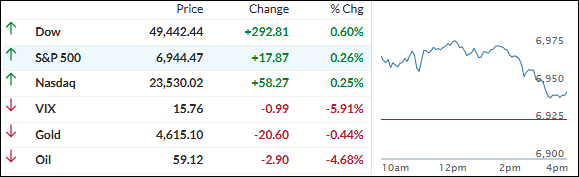
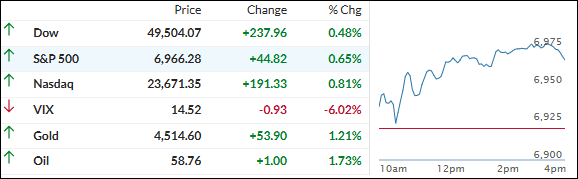
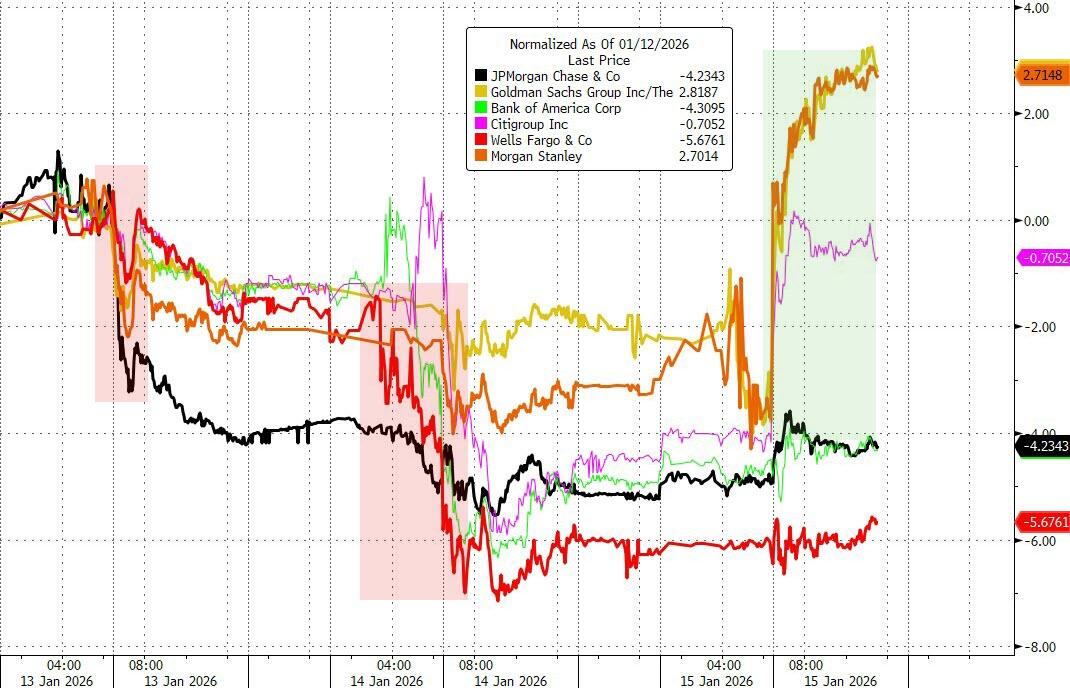
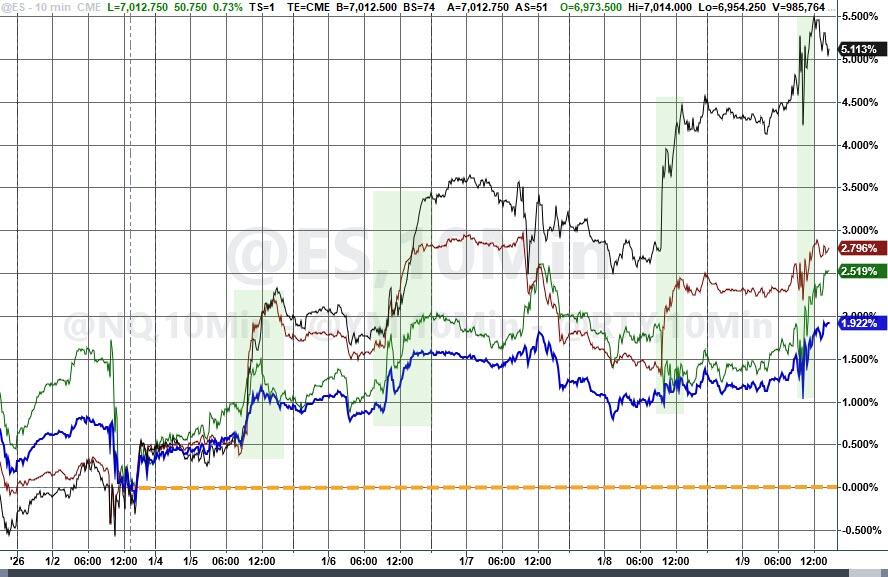
The major indexes jumped right out of the gate, with banks and tech leading the charge as Wall Street shook off back-to-back losing days.
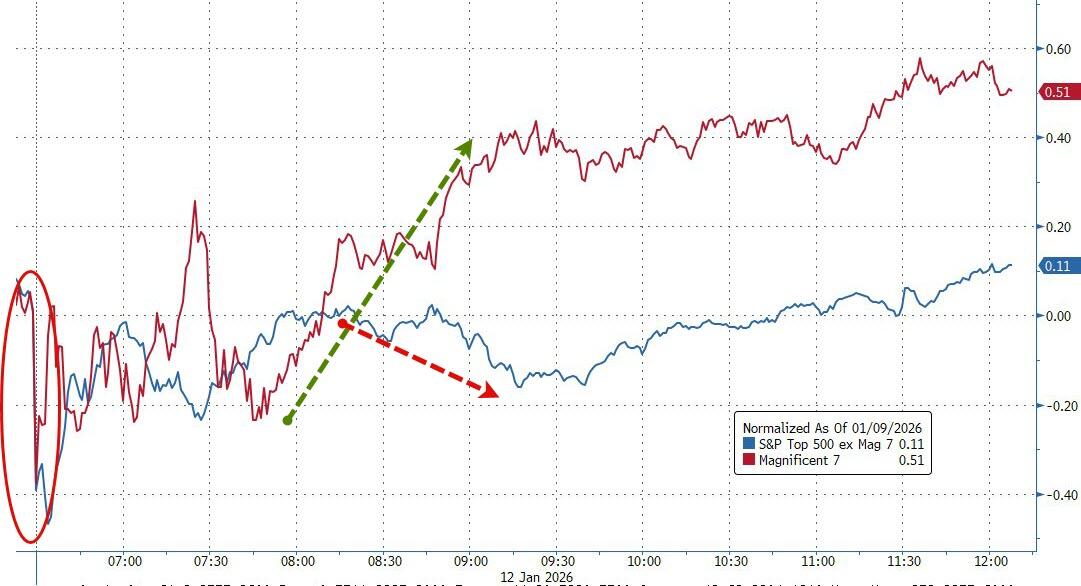
The real spark came from Taiwan Semiconductor (TSMC) dropping another monster quarter—profit up 35% year-over-year—which lit a fire under the AI trade and boosted investor confidence.
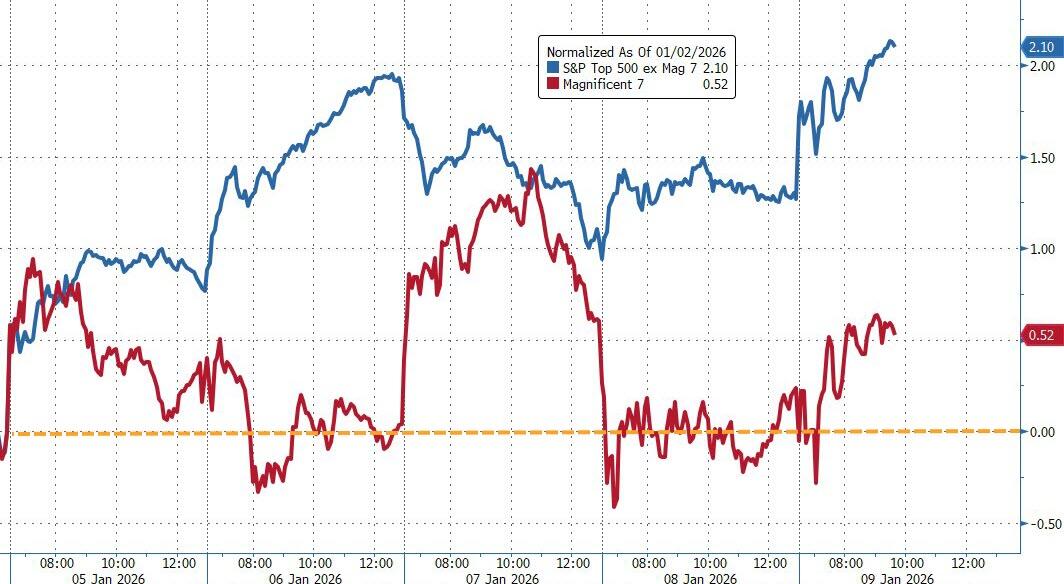
Chip stocks were on fire: the VanEck Semiconductor ETF (SMH) climbed 3%, Nvidia and Micron each added more than 2%, and the whole sector rode the wave.
This happened even after President Trump signed a 25% tariff on certain semiconductors (though chips tied to U.S. tech supply-chain buildout are exempt—so markets mostly shrugged).
Oil prices helped too—Brent and WTI both slid more than 4%, easing inflation worries. Plus, jobless claims for the week ending Jan. 10 came in at 198,000 (better than the 215,000 expected), giving the jobs market another thumbs-up.
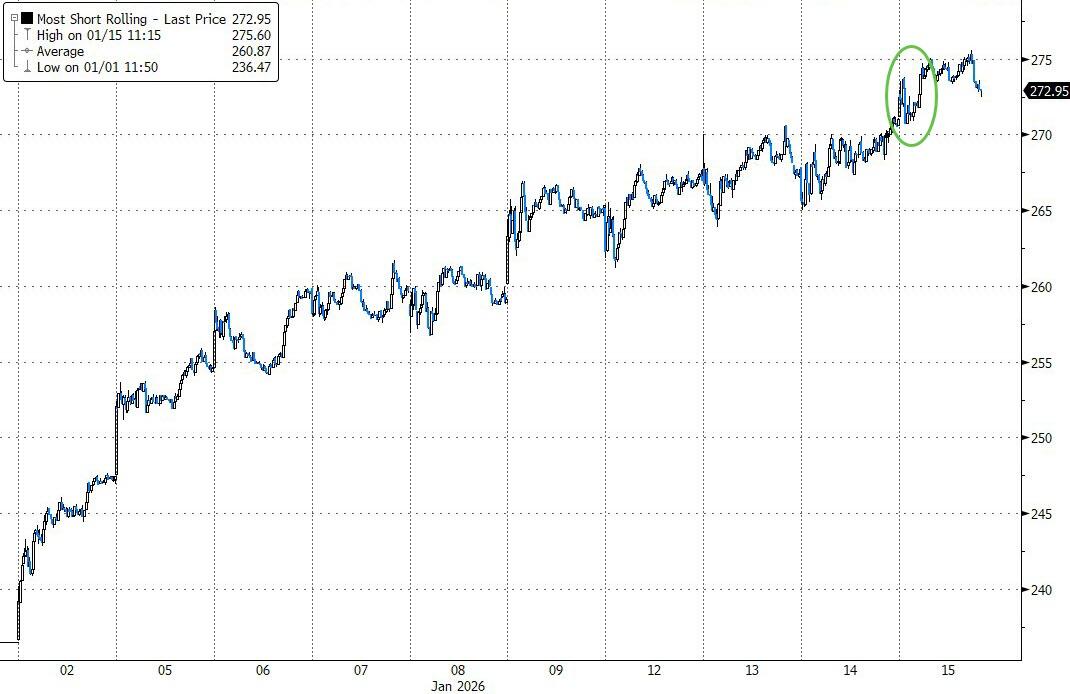
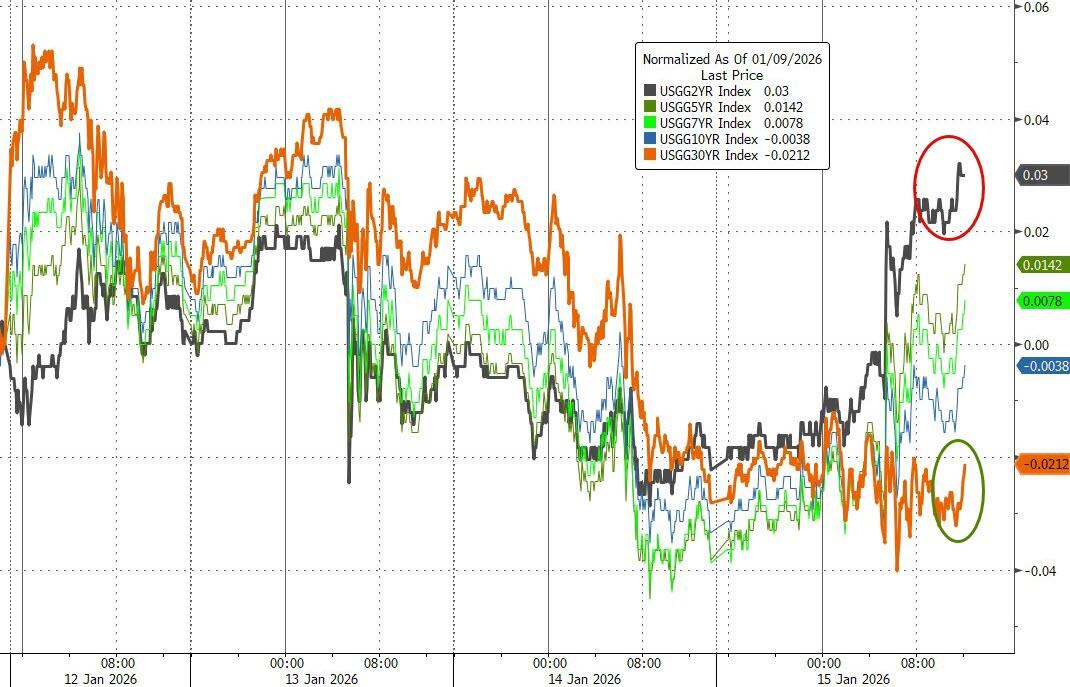
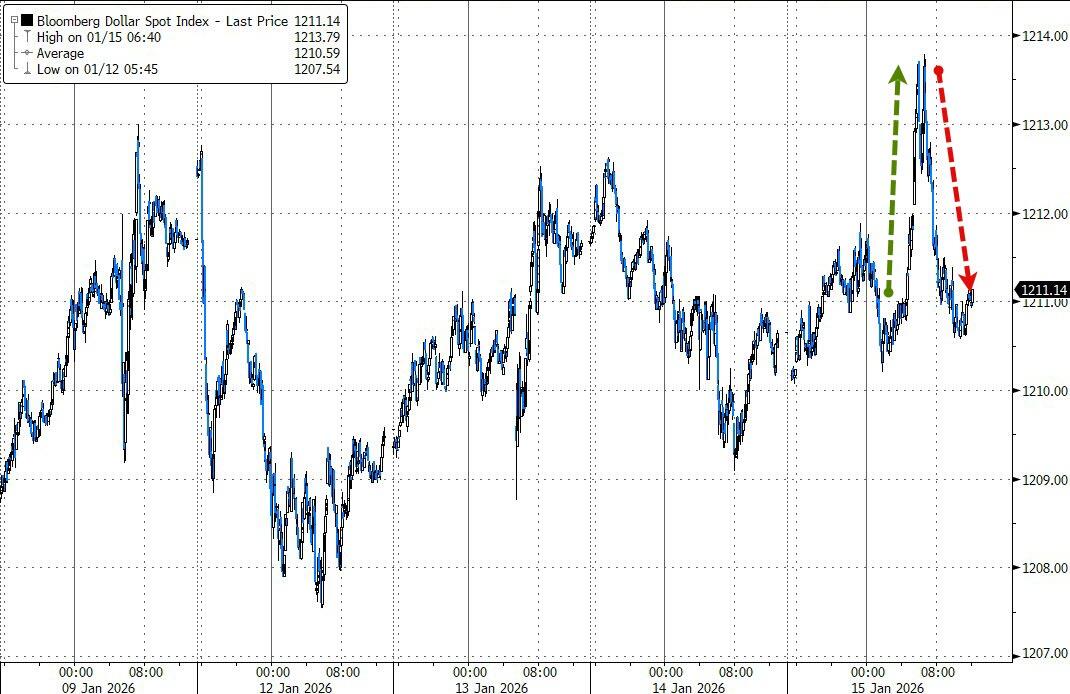
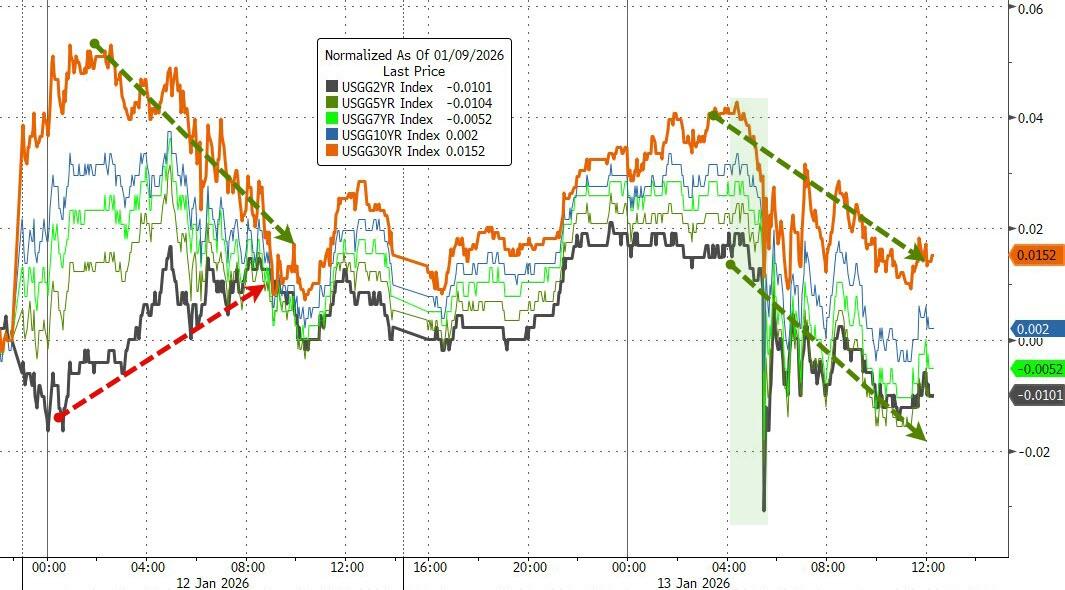
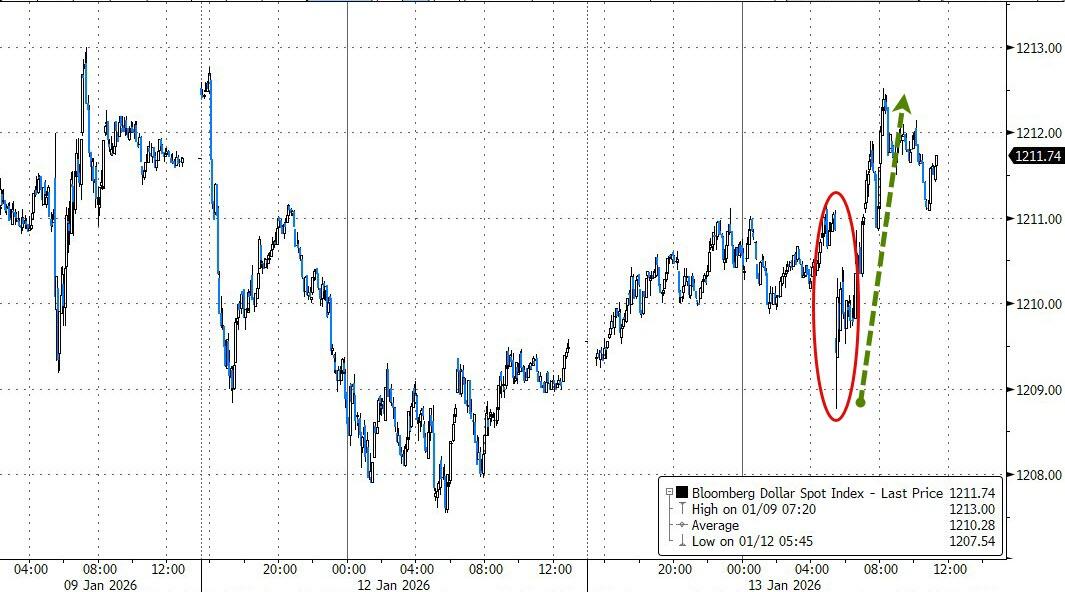
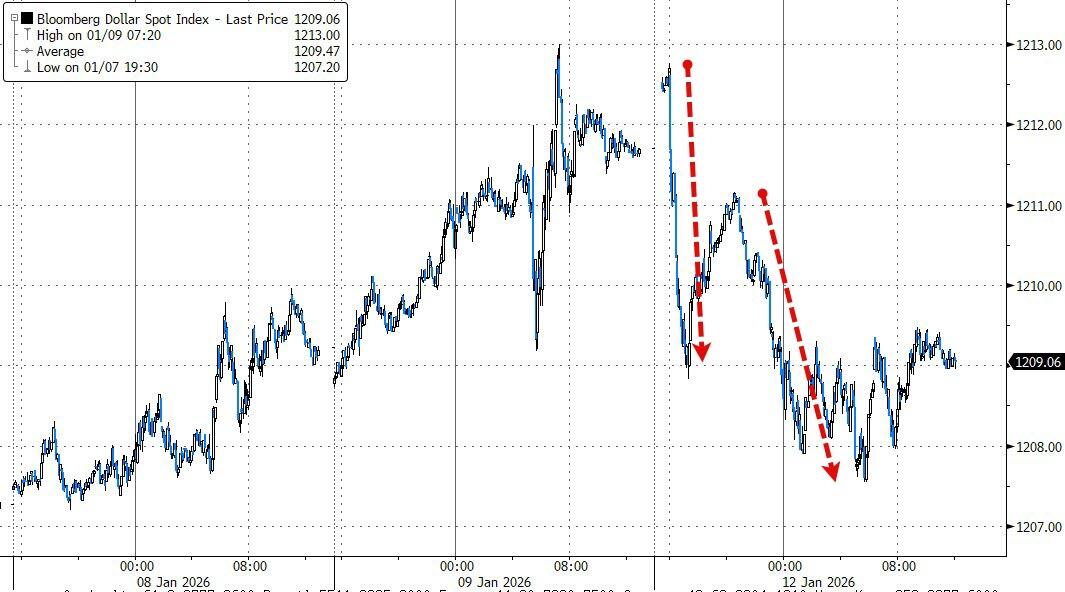
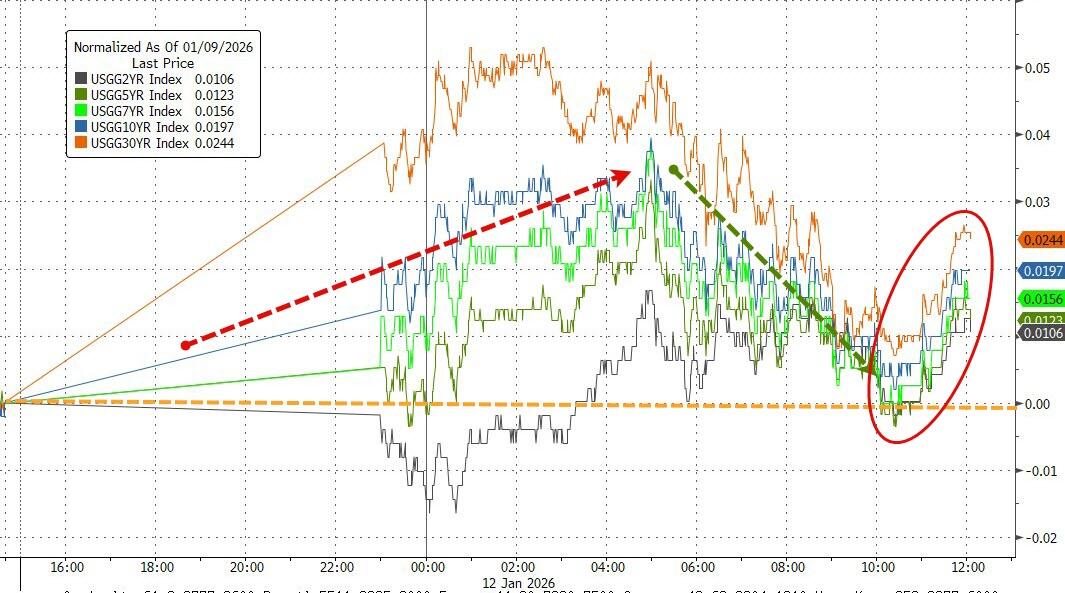
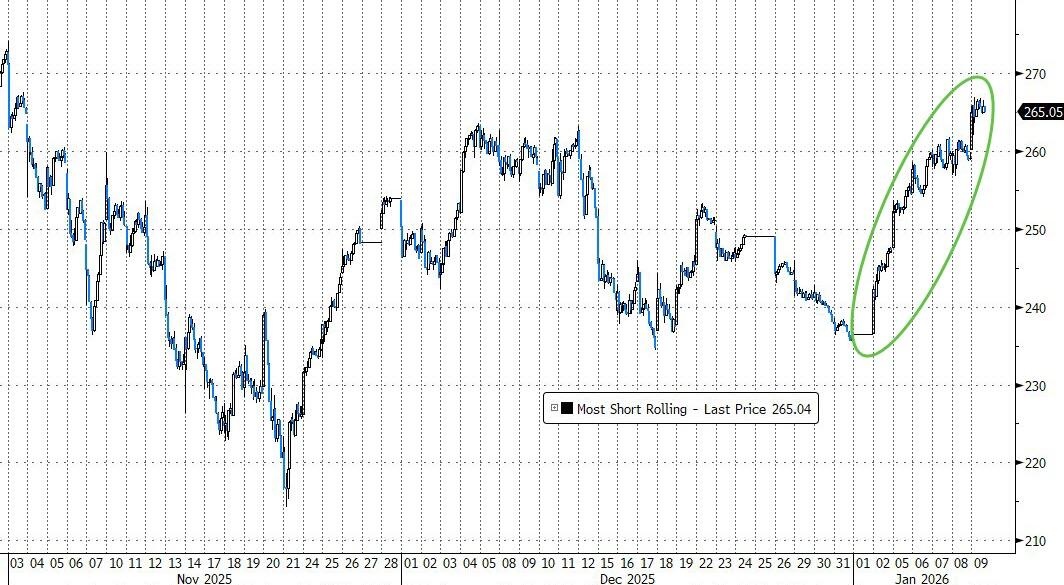
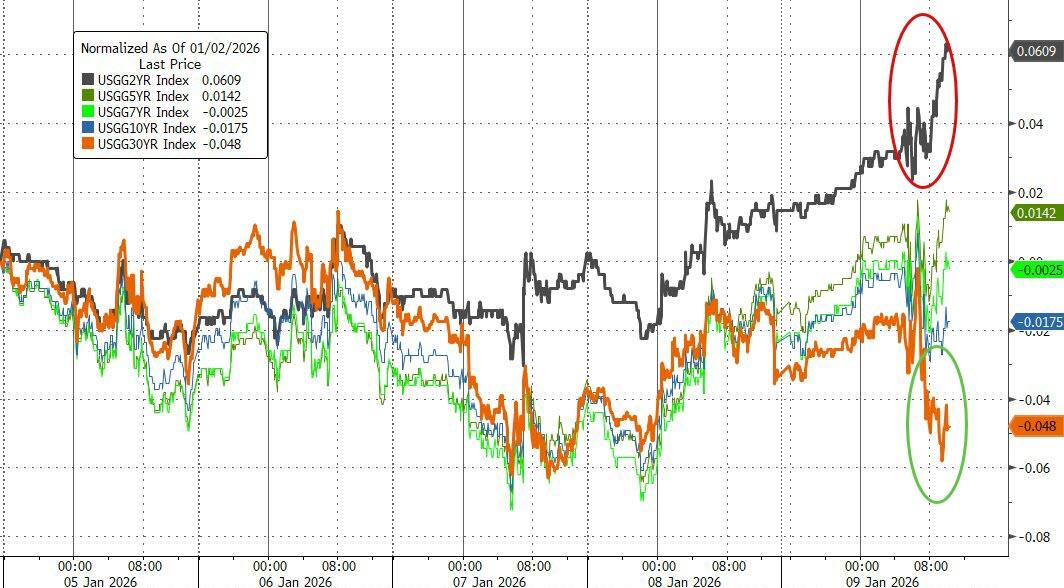
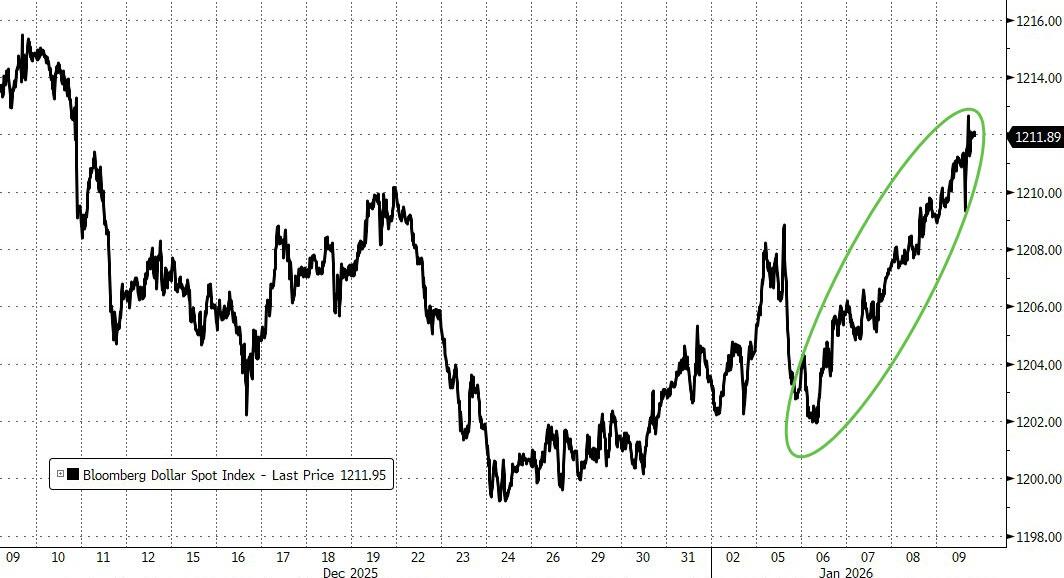
Small caps outperformed big time (thanks to another juicy short squeeze), even as bond yields ticked higher. The dollar did its usual pump-and-dump and ended flat.
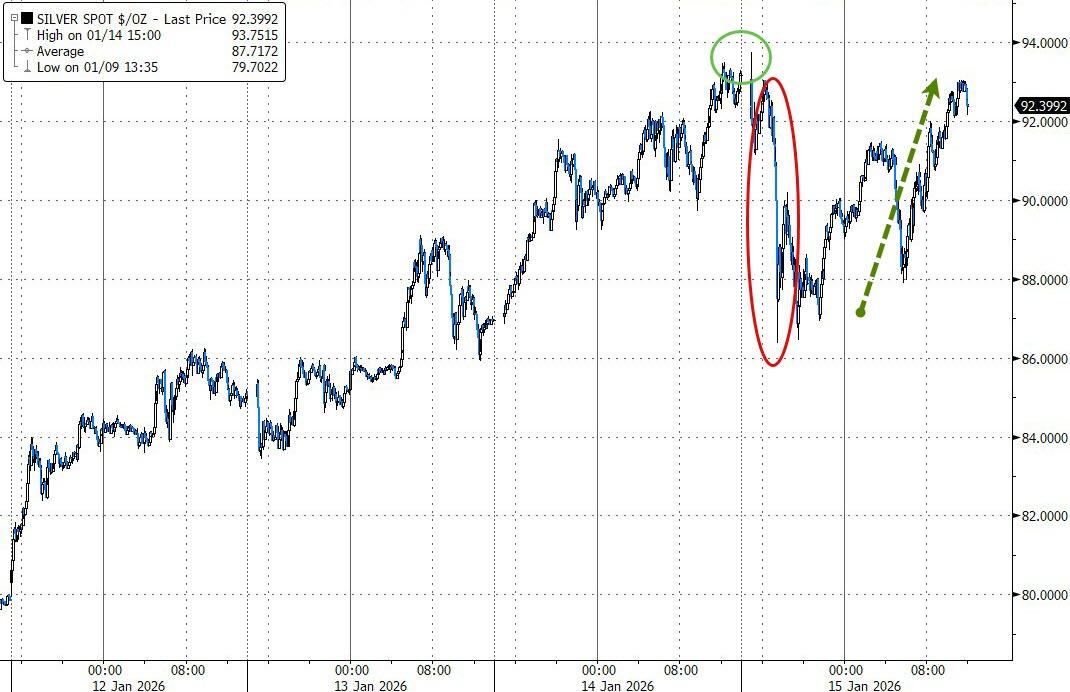
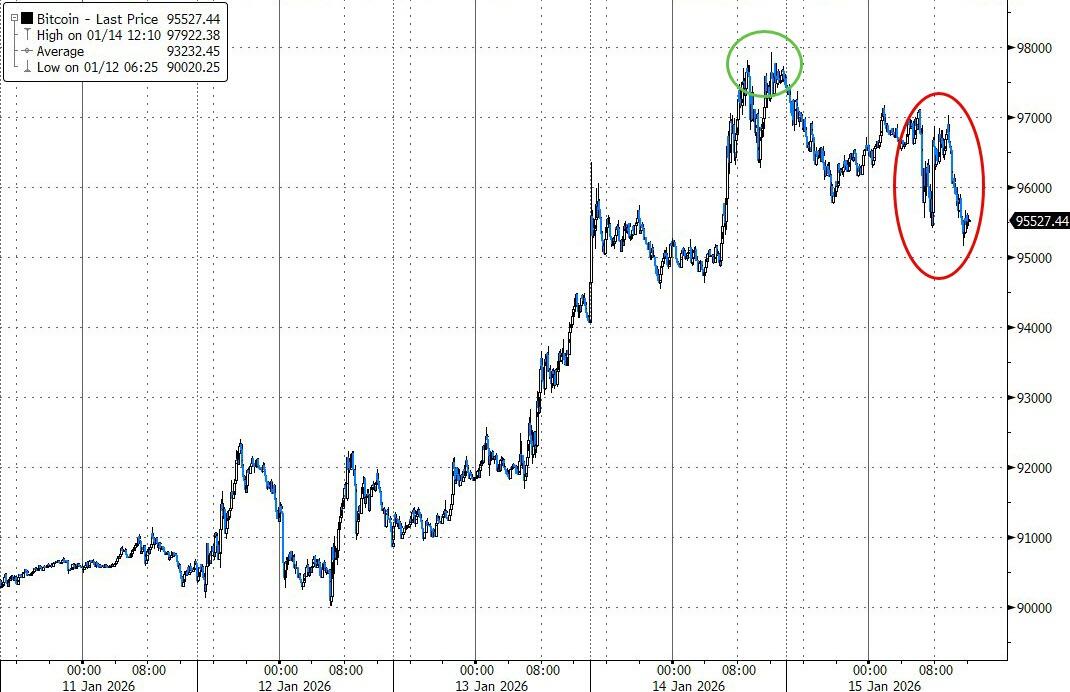
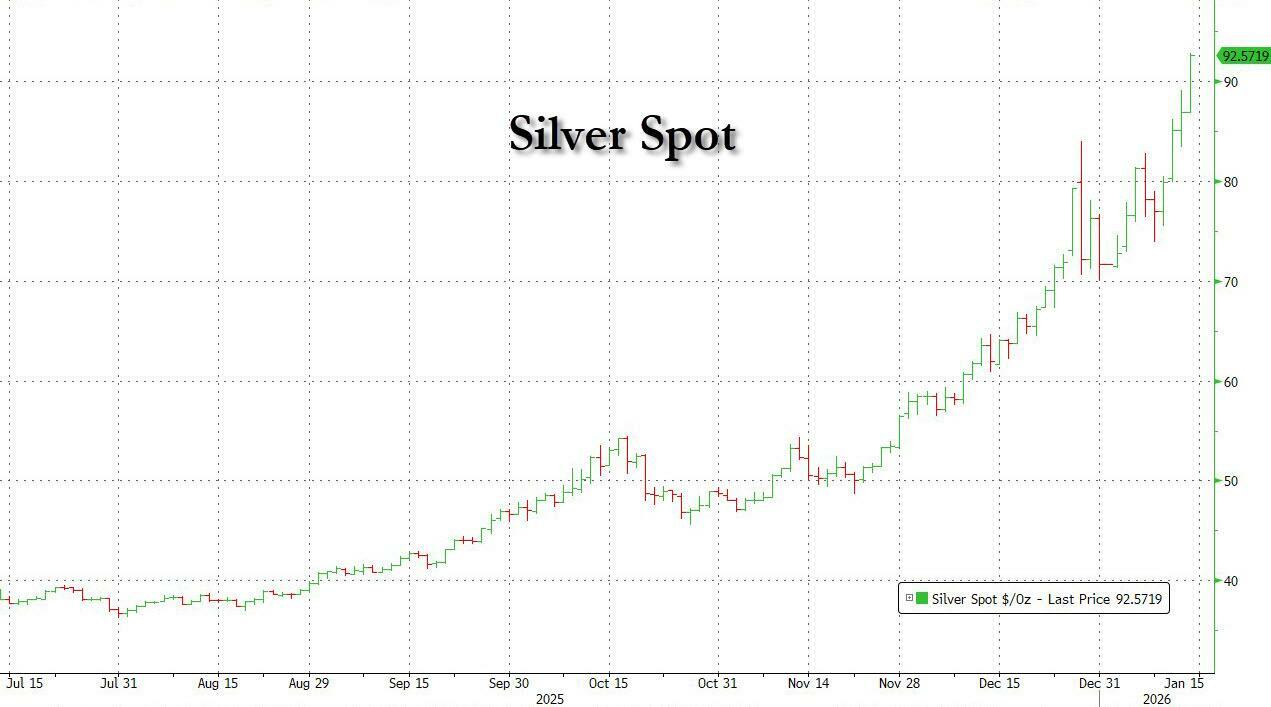
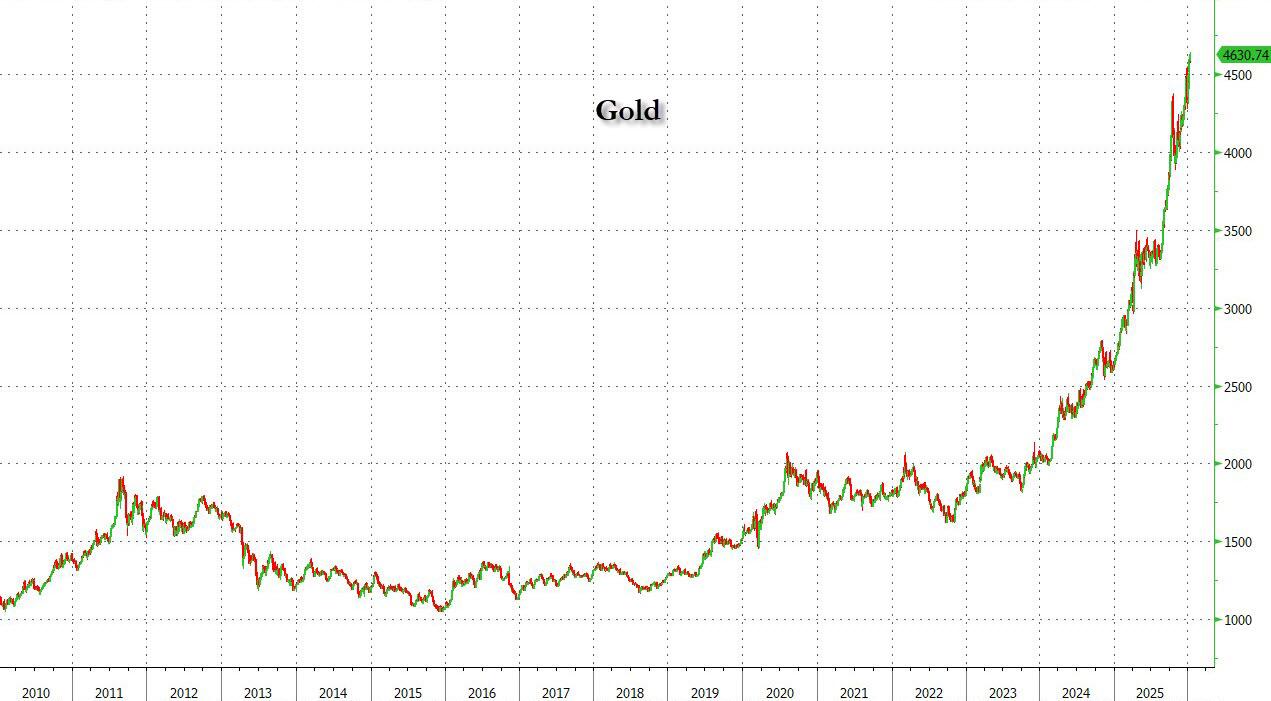
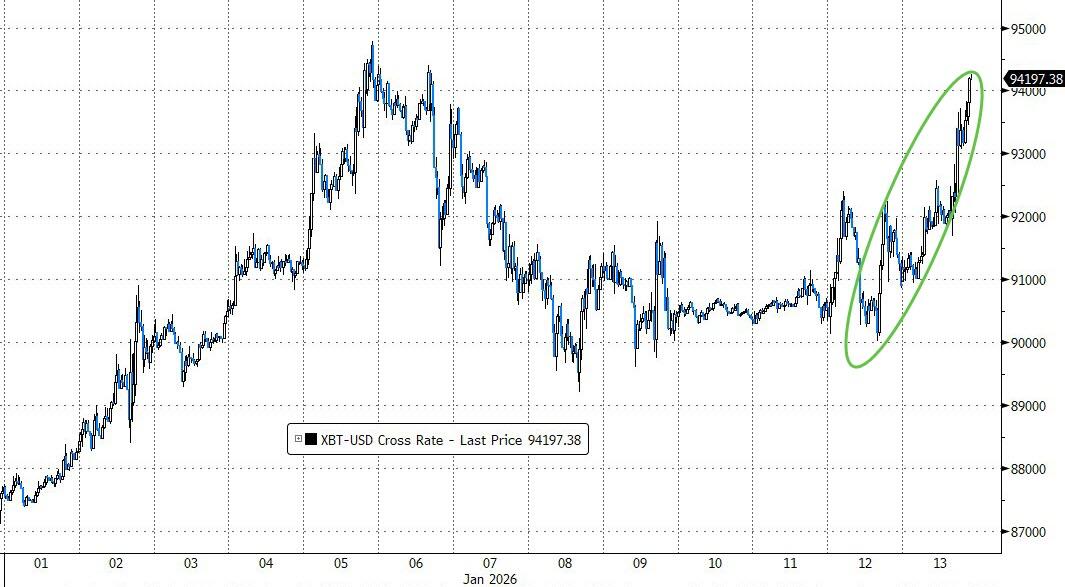
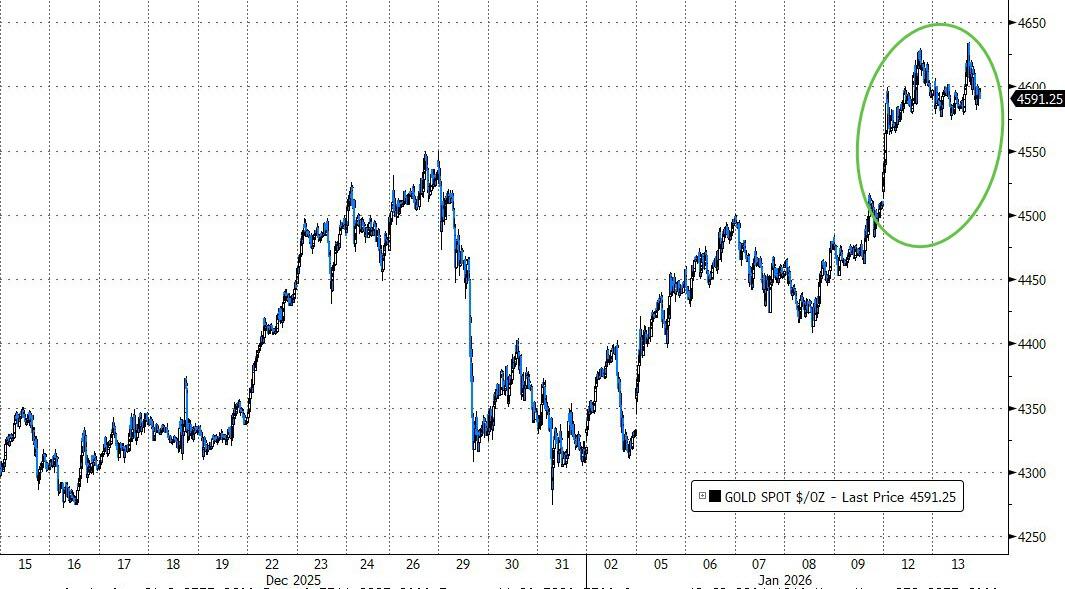
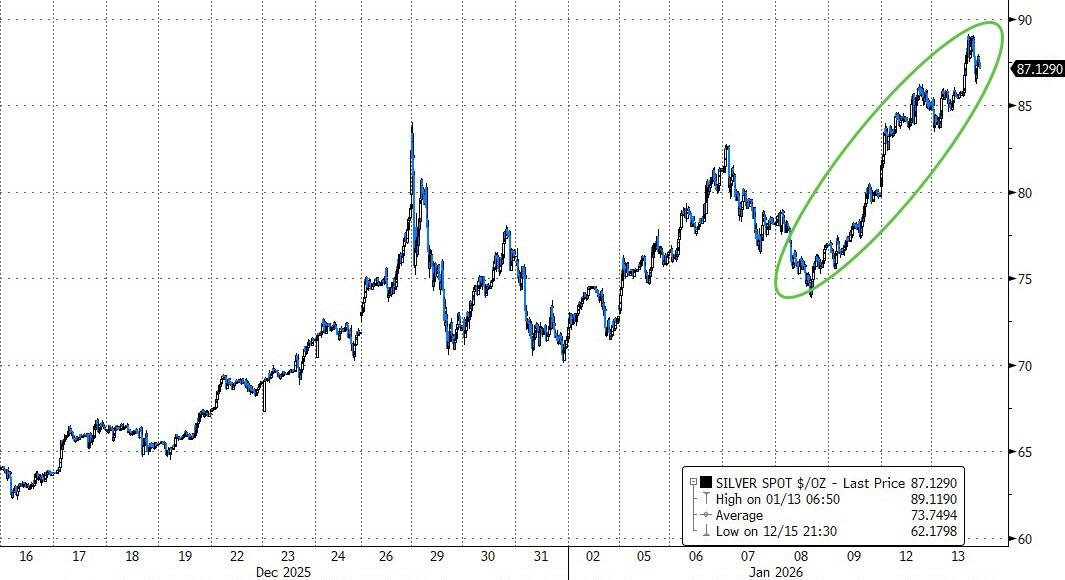
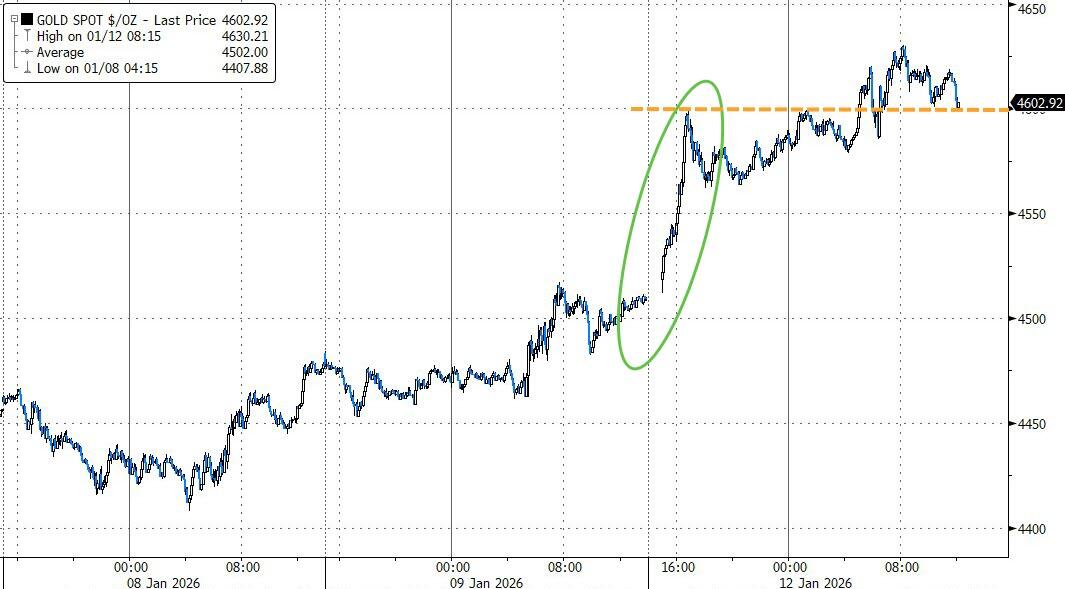
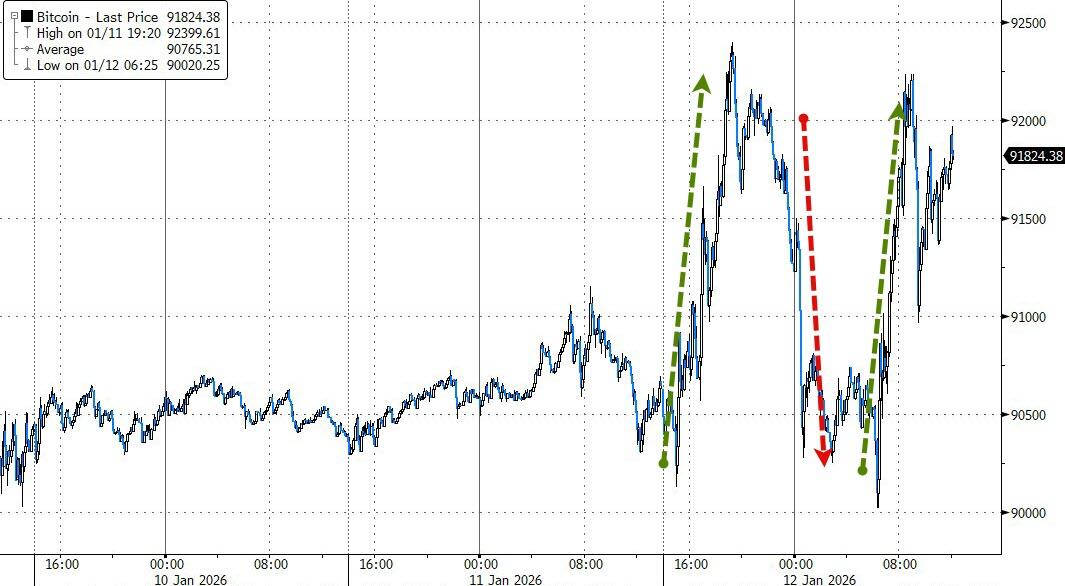
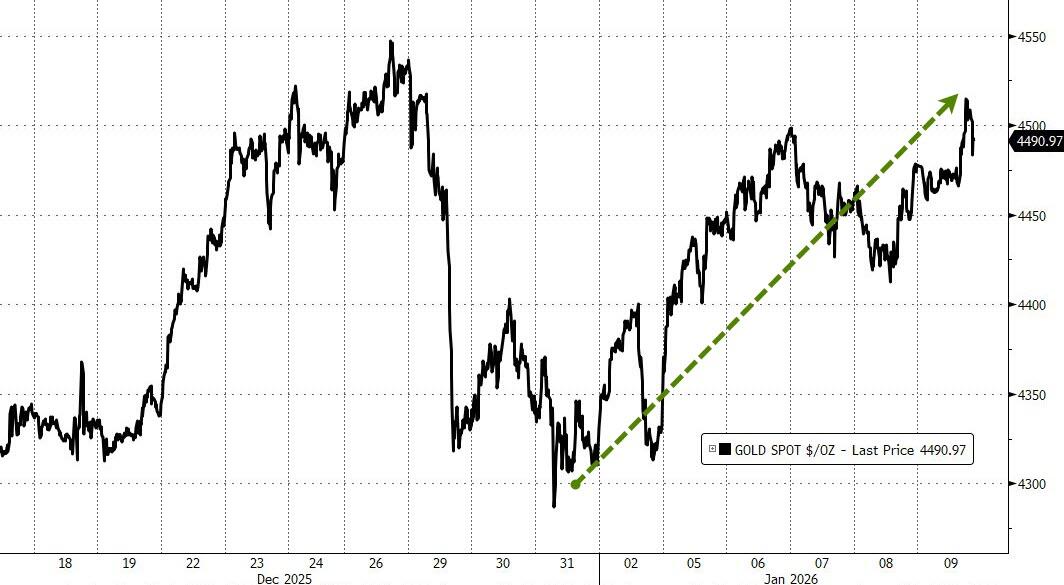
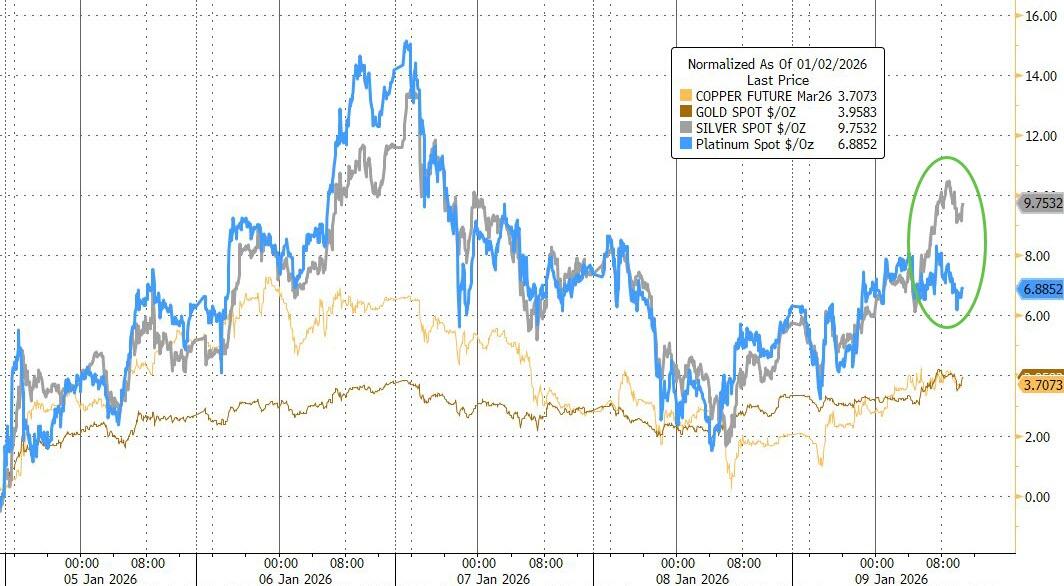
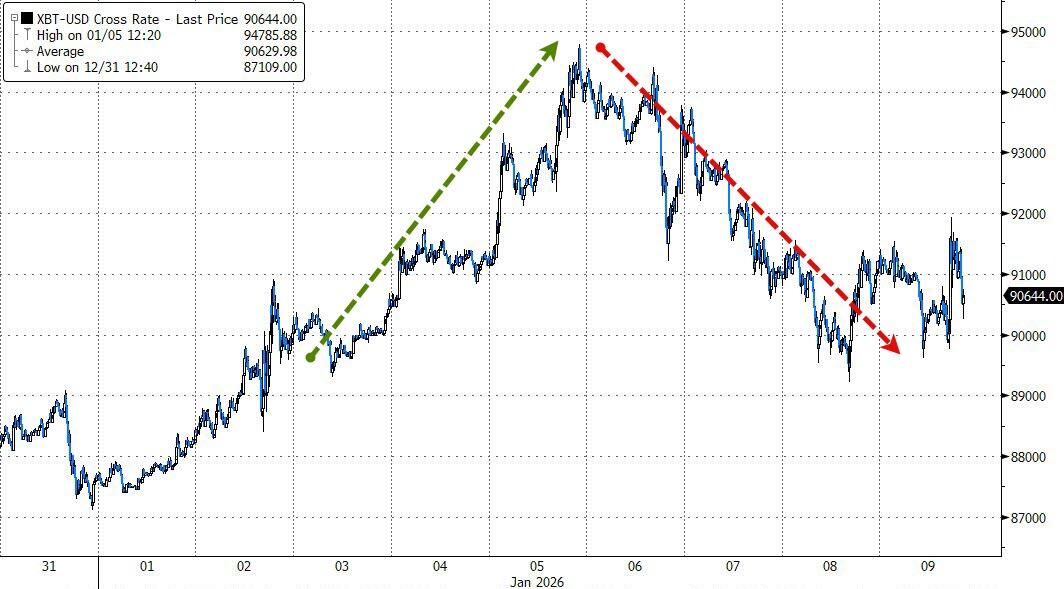
Metals took a breather after recent fireworks—silver touched a new intraday high of $93.75 early but swung wildly and closed about unchanged. Bitcoin tested $98K overnight before fading back to $96K.
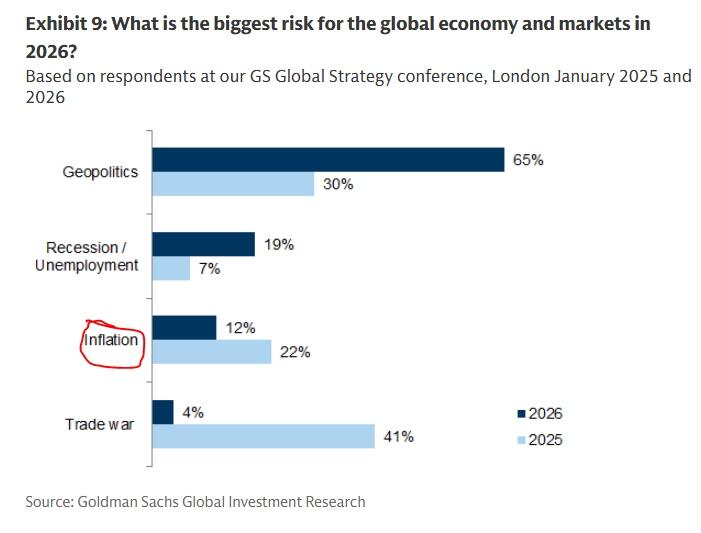
So, what’s the biggest risk for the global economy and markets in 2026? Goldman Sachs points to geopolitics as the top threat… but if history’s any guide, it’ll probably be something nobody saw coming.
With chip stocks roaring back, small caps squeezing shorts, and metals still holding strong despite a breather, this feels like the risk-on momentum is building again for 2026.
Read More