Reader Q & A: How Do I Use The ETF Cutline Table To Make A Buy Decision?

Ulli Reader feedback Contact

Reader Joe had the following question in regards to the best use of the ETF Cutline tables:

I’ve been reading your material and was wondering how far past the cutline into the positive do you go to initiate a buy?  Or do you then just put those ETFs on your radar and use other criteria to decide?  Thanks for the help.

Let me first point out again, that the real value of the ETF Cutline concept is at the beginning of a buy cycle when just about all equity ETFs are gathering momentum and are crossing the cutline (long-term trend line) to the upside.

With this bull market being over 2 years old, all worthwhile equity investment decisions have been made and much has played itself out. However, there are still isolated sectors/countries, which are crossing to the upside now after having rotated back and forth during this buy cycle.

Yes, you can and should use the cutline crossing as a sign to initiate a buy for new money. However, there are a few things you need to consider.
Read More

ETF Leaders And Laggards – For The Week Ending 5/20/2011

Ulli ETF Leaders & Laggards Contact

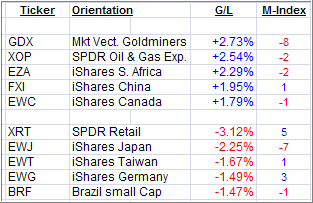
Here are this past week’s top 5 winners and losers from my High Volume ETF Master List:

In a repeat performance, the international TTI (Trend Tracking Index) has shown more weakness than the domestic one. This is clearly confirmed again by the worst performers of the bunch with 4 out of 5 being country ETFs.

Disclosure: No holdings

Reader Q & A: How Do I Start Investing With Your ETF Model Portfolios?

Ulli Reader feedback Contact

Several readers have emailed recently as to the best way to get started investing in the ETF model portfolios featured on my blog. Peter’s comment is very typical of the ones I received. This is what he had to say:

I would like to invest using one of your model portfolios. 1. Can I start now? 2. What percentage of my investment should I start with?

First, the “can I start now?” question has a come up on various occasions. Apparently, there has been some confusion in readers assuming that all portfolios are on hold due to my “Action” column in the Sell Stop tracking matrix indicating “Hold”.

To be clear, this “Hold” simply refers to the status of the respective ETF when it comes to its sell stop and NOT to the portfolio itself. In other words, as long as the domestic Trend Tracking Indexes (TTIs) are in “Buy” mode, meaning above their respective trend lines, you can set up a new portfolio at any time.

Read More

ETF/No Load Fund Tracker For Friday, May 20, 2011

Ulli ETF Tracker Contact

ETF/No Load Fund Tracker StatSheet

————————————————————-

THE LINK TO OUR CURRENT ETF/MUTUAL FUND STATSHEET IS:

https://theetfbully.com/2011/05/weekly-statsheet-for-the-etfno-load-fund-tracker-updated-through-5192011/

————————————————————

Market Commentary

Friday, May 20, 2011

A BULL IN THE HEADLIGHTS

This past week’s market activity resembled the same theme as we’ve seen lately. An early sell-off followed by a recovery attempt, and then a close within a few points of the unchanged line.

While it was a volatile ride again, the bulls appeared to be frozen and can’t seem to find their bearings thereby yielding the trading floor to the bearish crowd. However, neither bulls nor bears have been making any serious headway, which means we’re stuck in no man’s land.

While first quarter earnings were strong, recent economic data were not exactly a chest pounding event keeping the markets in neutral.

Taking center stage was the European debt crisis, which seems to be on the cusp of a major event taking place.

Read More

Weekly StatSheet For The ETF/No Load Fund Tracker – Updated Through 5/19/2011

Ulli ETF StatSheet Contact

ETF/Mutual Fund Data updated through Thursday, May 19, 2011

If you are not familiar with some of the terminology used, please see the Glossary of Terms.


1. DOMESTIC EQUITY MUTUAL FUNDS/ETFs: BUY— since 6/3/2009

As announced via a blog post, on 6/2/2009, the TTI triggered a buy signal with an effective date of 6/3/2009. We will use the 7% trailing stop loss of our positions as an exit point or the crossing of the trend line to the downside, whichever occurs first.

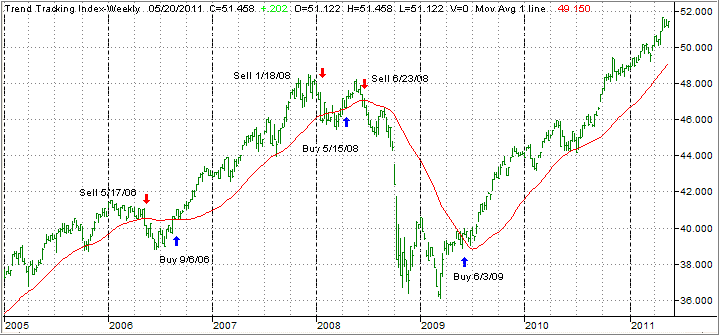
As of today, our Trend Tracking Index (TTI—green line in above chart) has broken above its long term trend line (red) by +4.99%.

Read More

High Volume ETFs On The Cutline – Updated Through 5/18/2011

Ulli ETFs on the Cutline Contact

Here’s the latest update of those High Volume ETFs, which are hovering within 20 positions below and above their Cutline (trend line). High Volume (HV) ETFs are defined as those with an average daily volume of $10 million or higher.

These ETFs are generated from my selected list of 90 that I use in my advisor practice. It cuts out the “noise,” which simply means it eliminates those ETFs that I would never buy because of their volume limitations.

While yesterday’s rebound was overdue after the recent slide, it only had a limited impact on this week’s report. The following equity ETFs slipped below the yellow cutline from their previous positive positions:

VPL (Japan Stock) from +5 to -1

BRF (Brazil small cap) from +4 to -2

SLX (Steel) from +3 to -3

EEB (Diversified Emerging Mkts) from +1 to -6

Again, when ETFs move above the line, that does not make them an automatic buy. You want those contenders to remain there for a while and build up positive momentum numbers all the way across (4 wk, 8 wk, 12 wk, YTD) before considering them as investment quality material.

If you look at the table, you will notice only one ETF that fulfills these criteria.

Read More