Traders Brace For Nvidia Earnings: Rally Or Sell-Off?

Ulli Market Commentary Contact

[Chart courtesy of MarketWatch.com]

  1. Moving the markets

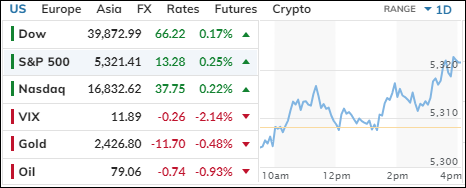
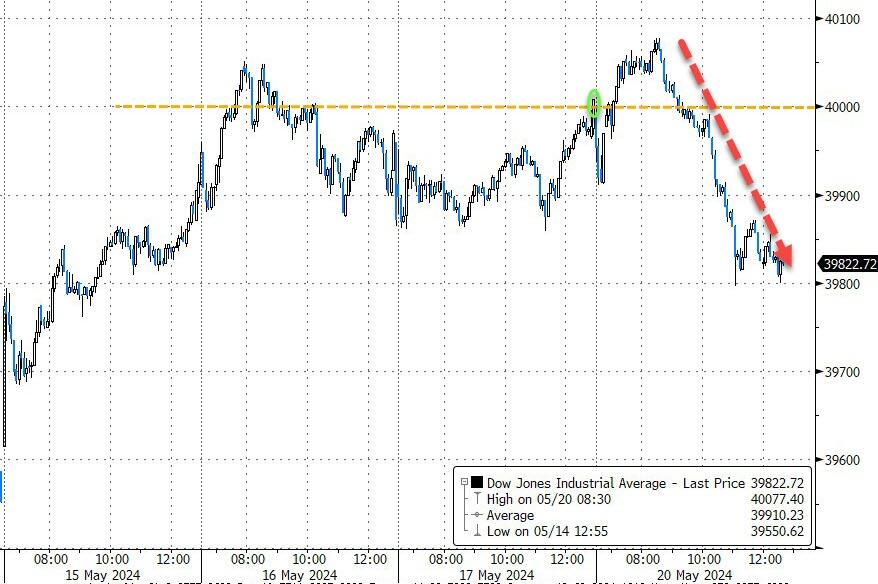
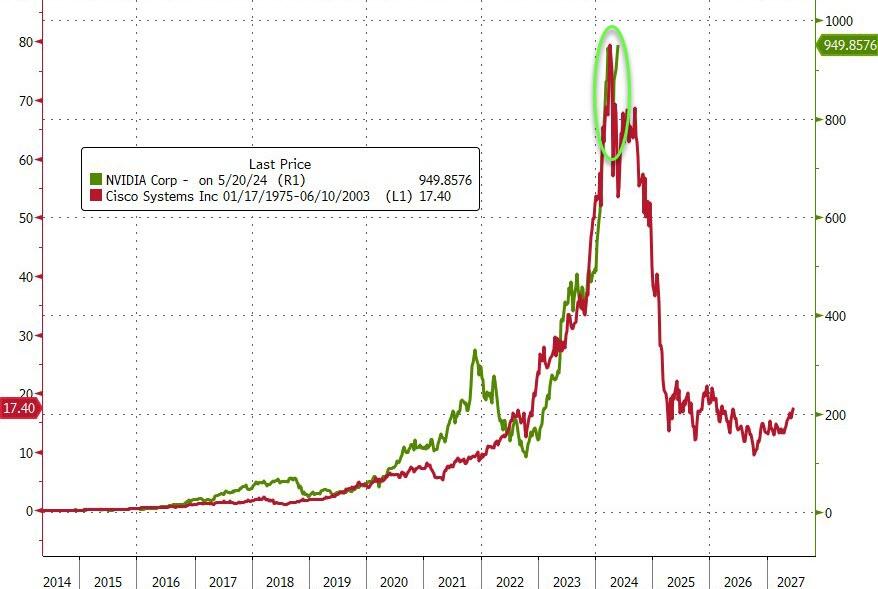
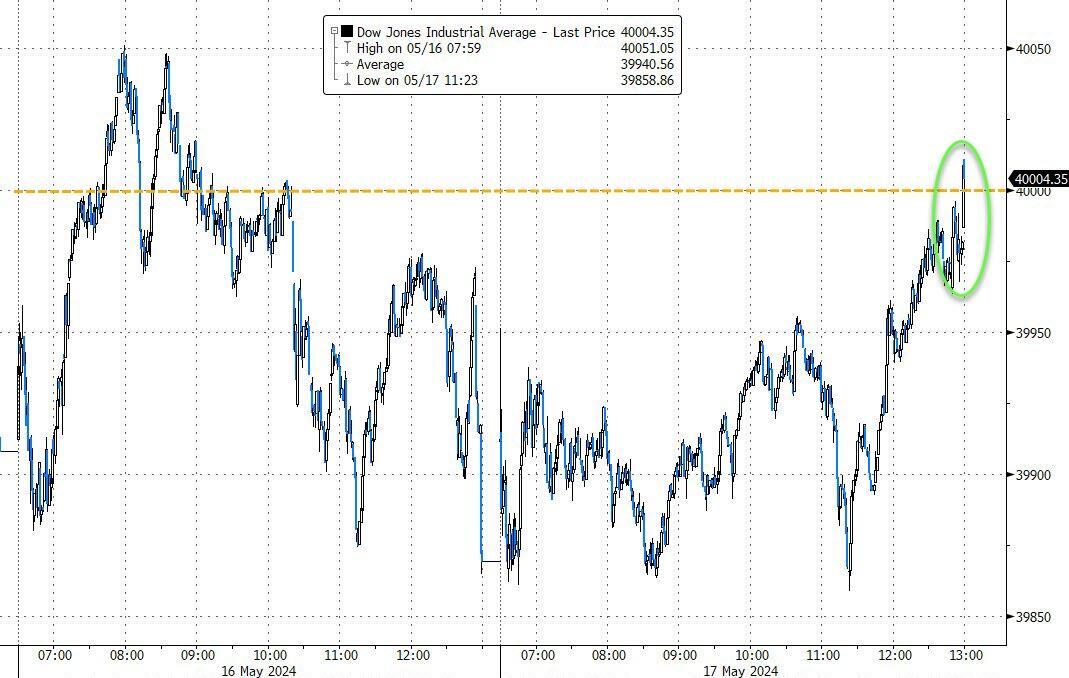
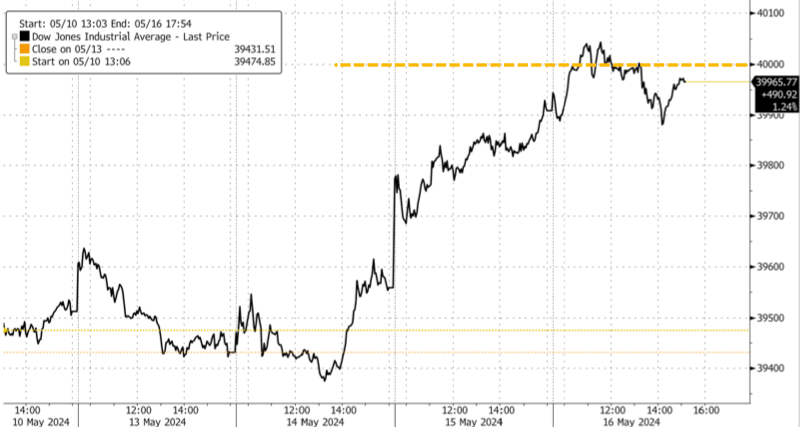
The major indexes hugged their unchanged lines today, hanging on to the record levels seen in the previous session, as traders eagerly looked toward Nvidia’s earnings report tomorrow. However, a last hour lift insured a green close.

There are two ways to view this important earnings announcement. On one hand, traders are heavily invested in the stock, so if the numbers are good, they won’t miss out on the instant rally. On the flipside, should the numbers be disappointing, a sell-off may be fast and furious.  

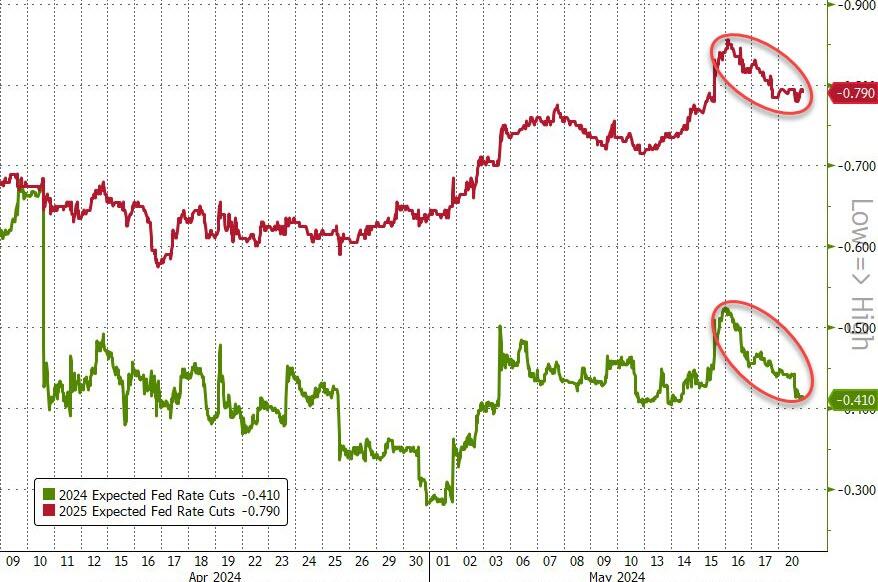
Also, traders are listening to what the Fed’s mouth pieces are uttering. For example, Fed Governor Waller said he wants to see “several months” of supportive inflation data before lowering rates. Others, like Barkin and Bostic are due to voice their opinions later.

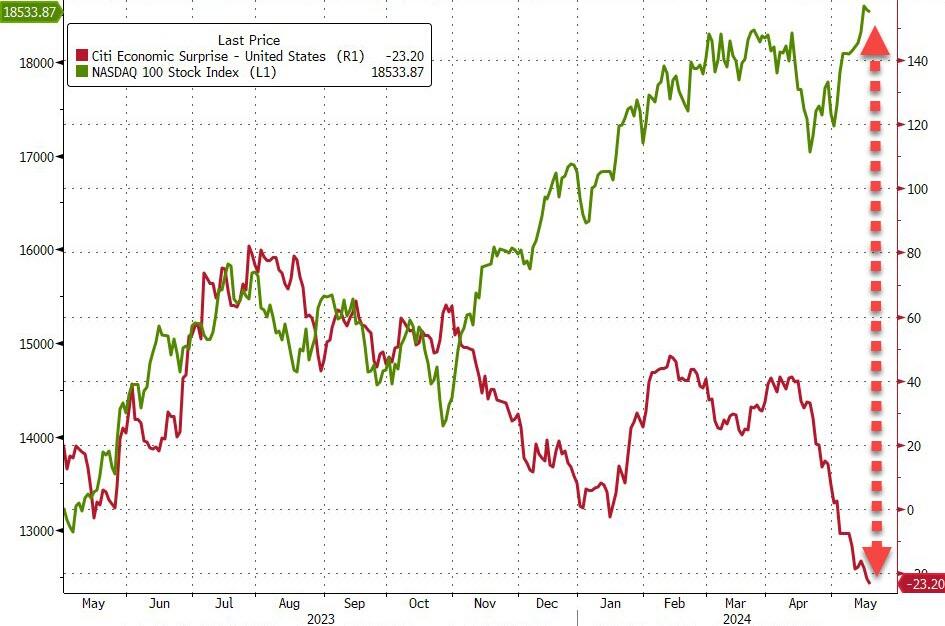
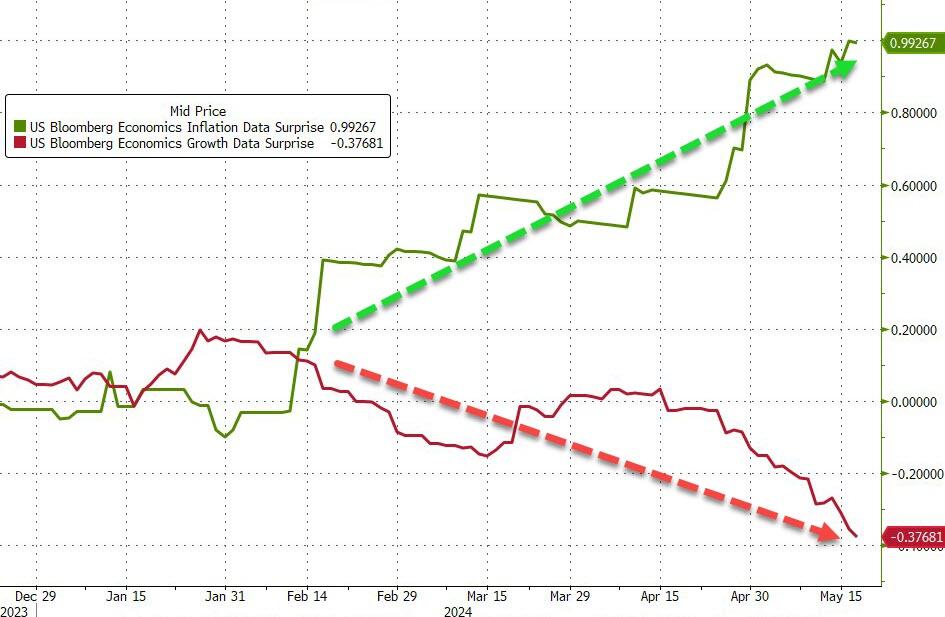
It’s interesting to note that traders have “brushed aside” several components of inflation amid some concerning consumer data points. Again, Wall Street has a hard time accepting the fact that “stagflation,” namely weak or no economic growth and continuing inflation, surrounds us.  

It’s a quiet story and, while traders and algos have priced the markets for perfection, there are many events that could either disrupt the current scenario or even bring it to an abrupt end. However, for the time being, we remain in bullish mode.

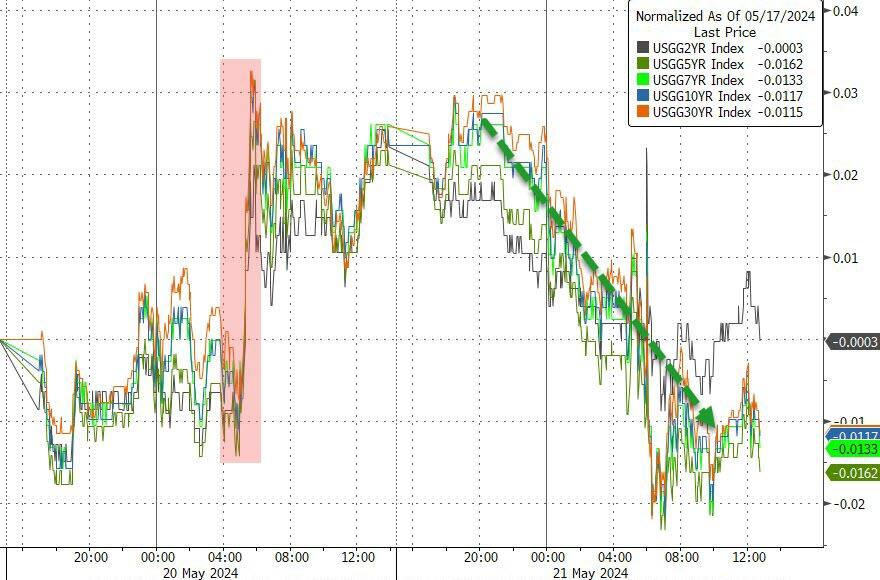
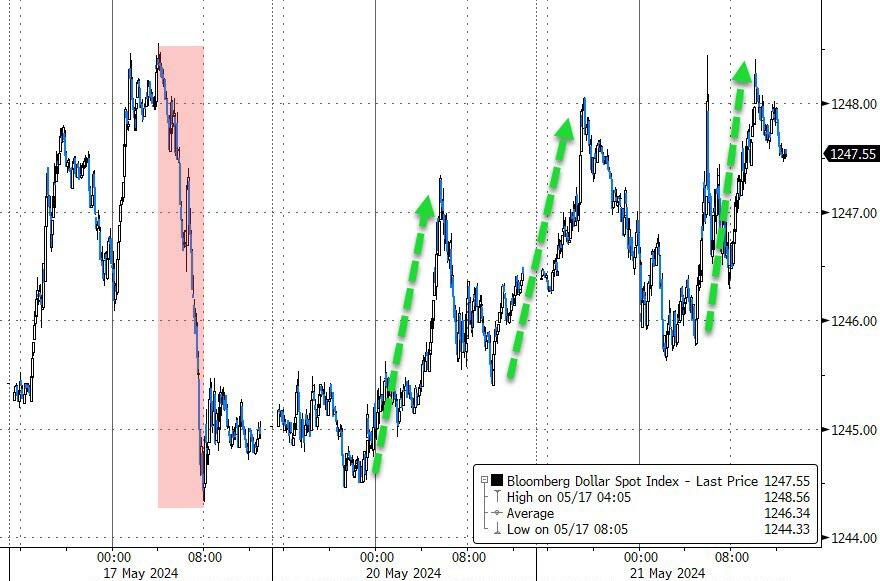
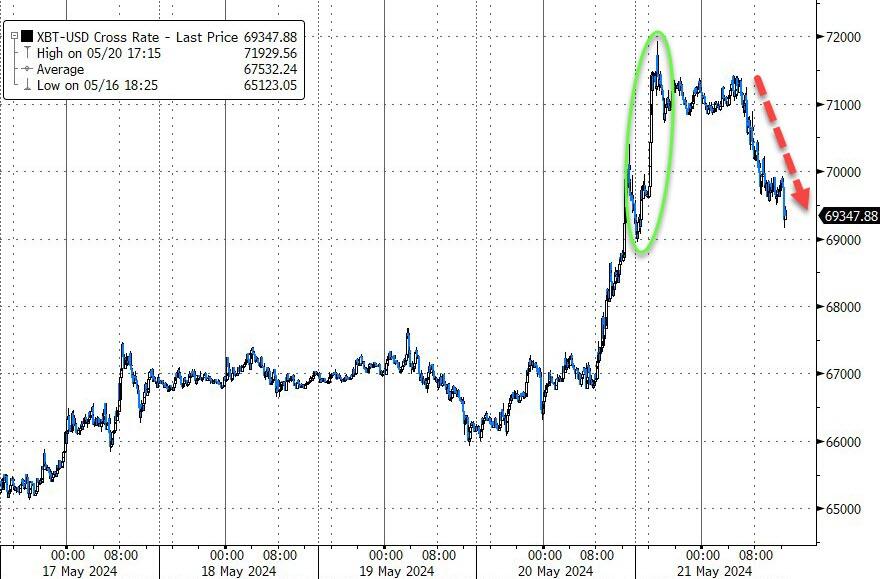
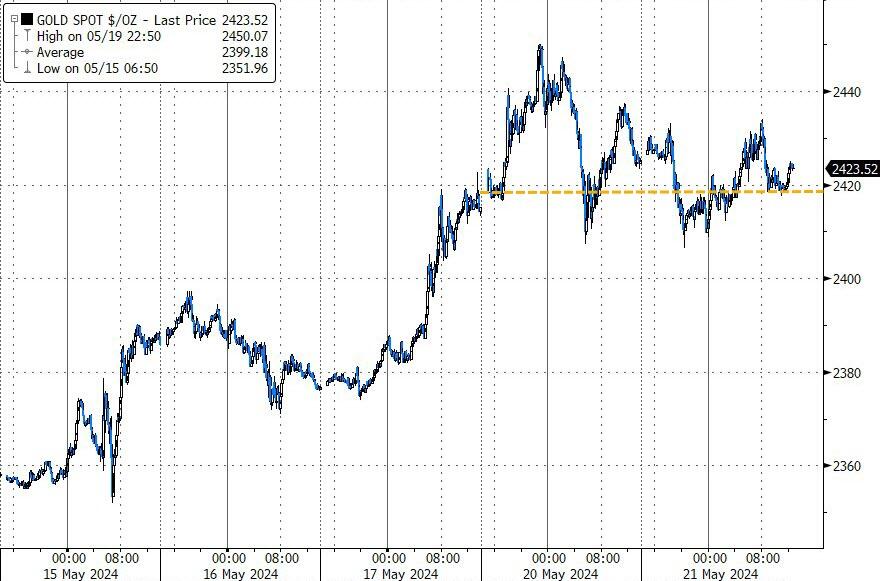
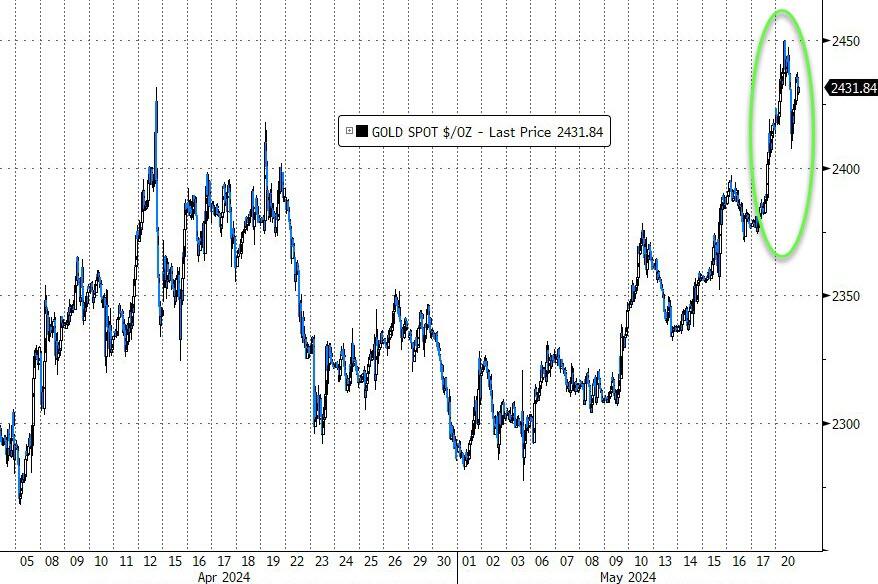
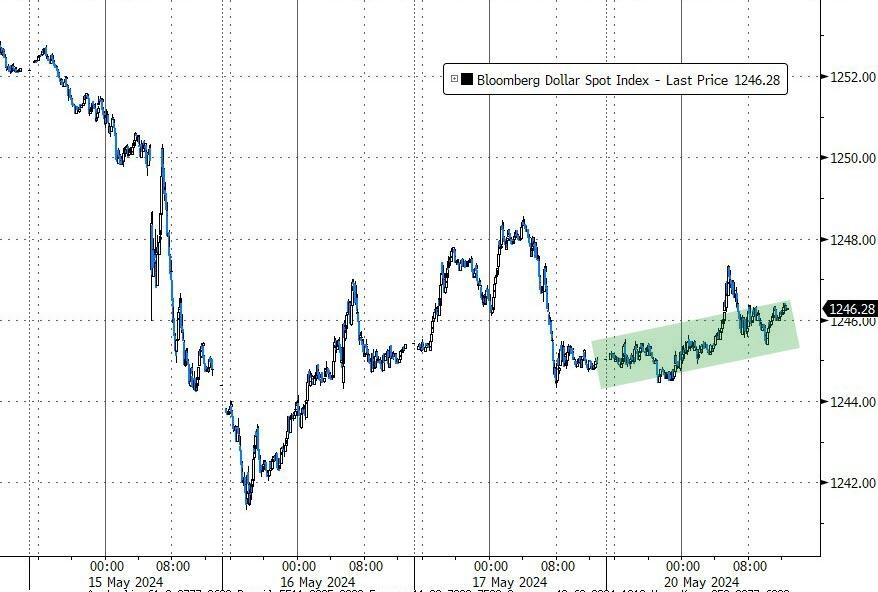
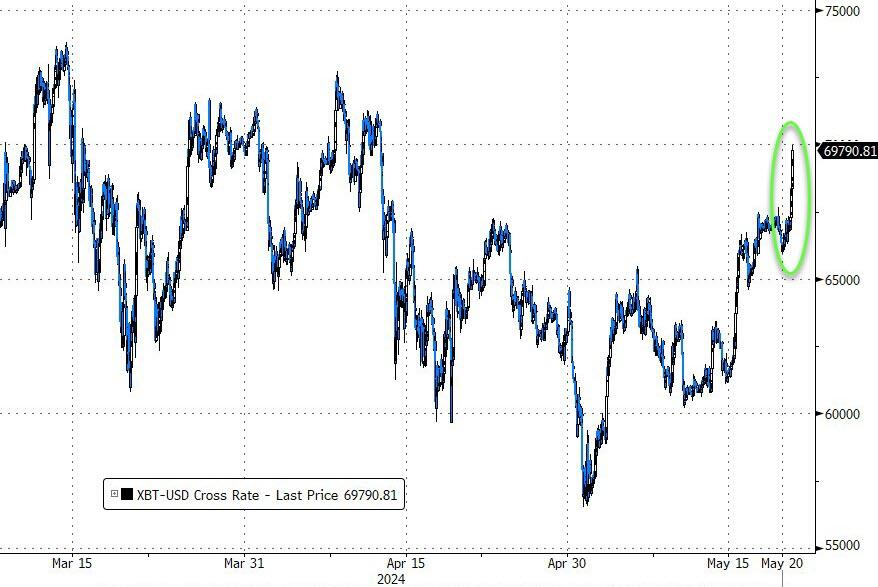
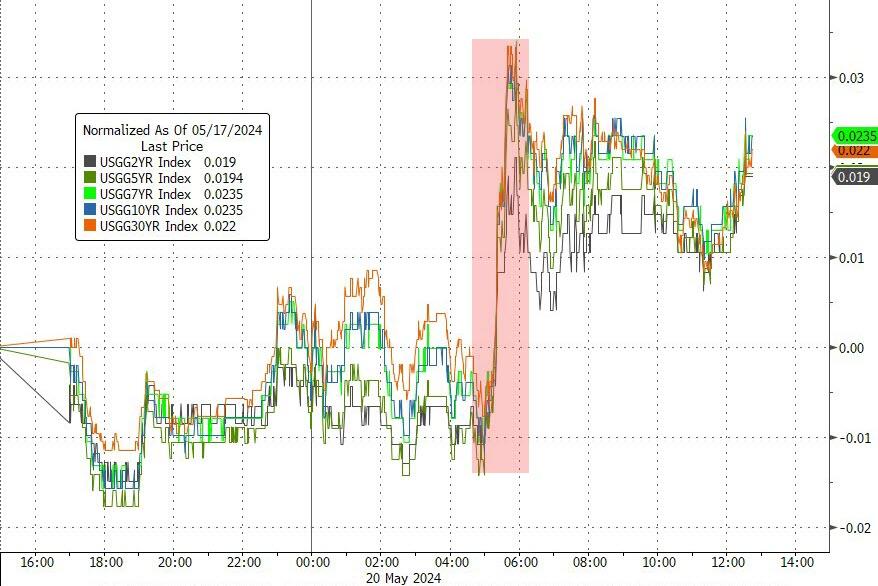
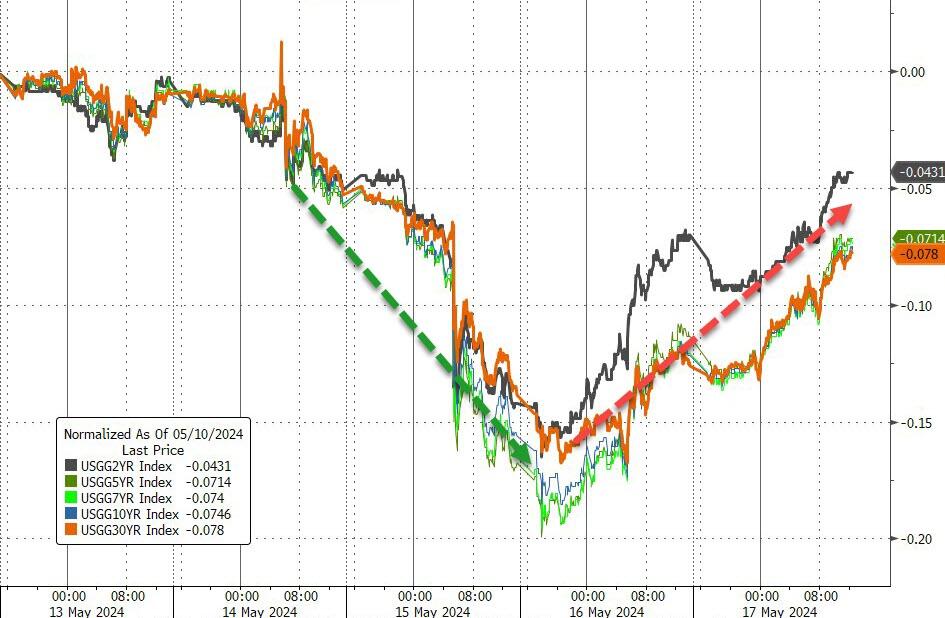
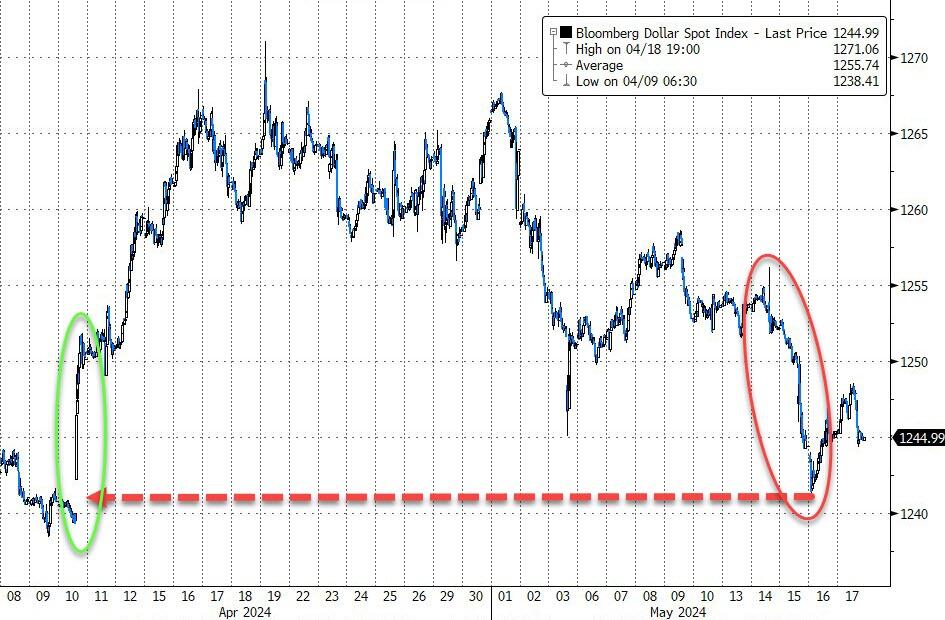
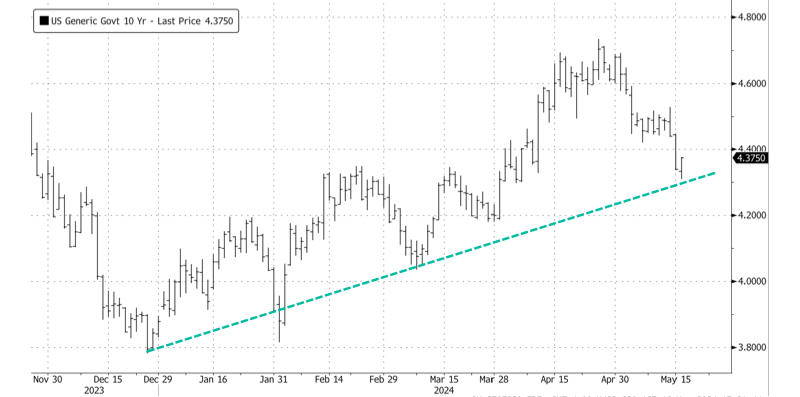
Bond yields slipped wiping out most of yesterday’s dash, with the dollar whipsawing but erasing Friday’s losses.  Bitcoin stumbled from its overnight surge, while gold hurried around all session but did not make any headway.

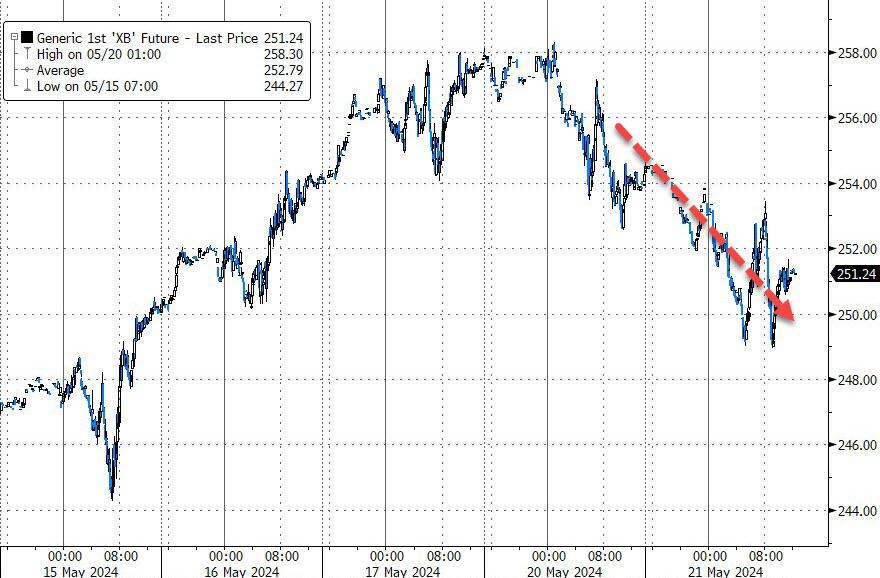
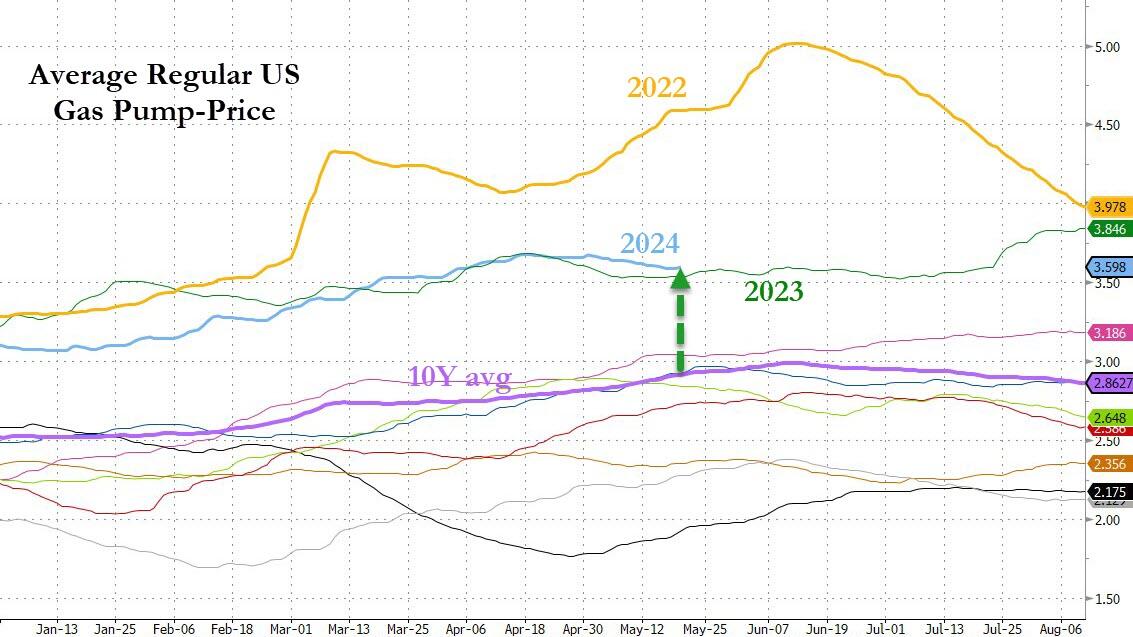
Temporary relief for consumers arrived at the pump, as the Biden Administration announced the release of its strategic gas reserve causing wholesale prices to retreat. Still, it looks like gas prices this coming Memorial weekend will be the second most expensive in a decade, as ZH pointed out.

That will matter this coming weekend. Right now, all eyes are on Nvidia’s earnings report. Will it help the bulls, or will bears find reason to rejoice?

Read More

Precious Metals Soar, Bitcoin Nears $70K, As Rate Cut Hopes Fade

Ulli Market Commentary Contact

[Chart courtesy of MarketWatch.com]

  1. Moving the markets

The major indexes edged higher Monday, boosted by gains in the tech sector, as the Dow attempted to build on its rally above the key 40,000 level. That effort failed at midday, and the index closed below that milestone.

Traders are eagerly awaiting Nvidia’s quarterly results due out Wednesday to better evaluate not only the strength of the AI powered rally but also whether these sky-high prices are justified.

Of course, relentless optimism prevails with some Wall Street firms suggesting that the tech darling could gain as much as 30% from current levels. Nvidia currently has the third largest market cap in the S&P 500.

Currently, traders are still clinging to hopes for a series of interest rate cuts in 2024, a trend that has been in place for over a year. I think this view will lead to disappointment, as inflationary forces are continuing to accelerate in part due to ongoing debt and deficits, which are a result of unrestrained government spending. After all, currently our government needs to borrow $1 trillion every 100 days to pay its bills. Ouch!

When all was said and done, the markets were mixed, as the Nasdaq outperformed, the Dow closed in the red, and the S&P 500 only eked out a tiny gain. The MAG7 stocks rallied sharply but faded late in the session.   

Gold and silver rocketed higher, the dollar closed modestly in the green, but Bitcoin exploded but stopped just short of the $70k marker. Bond yields climbed moderately, as rate cut expectations drifted lower.

With Nvidia’s earnings on deck, the comparison to Cisco Systems comes into play again begging the question: Will history repeat itself?

Read More

ETFs On The Cutline – Updated Through 05/17/2024

Ulli ETFs on the Cutline Contact

Do you want to know which ETFs are hot and which ones are not? Then you need my High-Volume ETF Cutline report. It tells you how close or far each of the 311 ETFs I follow is from its long-term trend line (39-week SMA). These are the ETFs that trade more than $5 million a day, so they are not some obscure funds that nobody cares about.

The report is split into two parts: The winners that are above their trend line (%M/A), and the losers that are below it. The yellow line is the line of shame that separates them. You can see how many ETFs are in each group and how they have changed since the last report (265 vs. 278 current).

Take a peek:

The HV ETF Master Cutline Report

If you are confused by some of the terms we use, don’t panic. I have a helpful Glossary of Terms for you.

If you want to learn more about the Cutline method and how it can make you rich (or at least less poor), read my original post here.

ETF Tracker Newsletter For May 17, 2024

Ulli Market Commentary Contact

ETF Tracker StatSheet          

You can view the latest version here.

FED’S DILEMMA: CAUGHT BETWEEN ROCK AND HARD PLACE

[Chart courtesy of MarketWatch.com]

  1. Moving the markets

The Dow meandered near the flat line today, after the index briefly topped the key 40,000 level for the first time in the previous session. A last hour drive by the algos pushed 2 of the 3 majors back into the green to end Thursday’s run on a positive note, with the Dow closing above 40k for the first time.

This week’s rally has helped thrust the three indexes into positive territory for the second quarter despite a sluggish start. The S&P 500 and Nasdaq are now each up more than 11% in 2024, while the Dow has climbed more than 5% on the year. Yet, gold remains the top performer with a gain of almost 17%.

Traders still insist that positive economic growth and weakening inflation will continue to be the driver for higher prices, but reality is that we have moved into a stagflation environment, with accelerating inflation and slower growth now being the dominant forces.

The US Macro Surprise index declined for the sixth straight week to its weakest since January 2023, as Zero Hedge pointed out. While that is bad news, Wall Street considers it good news, as risky stocks have risen in the face of a slowing economic environment, with the spread increasing almost daily. Go figure…

Monday’s short squeeze faded as the week went on, Bond yields slipped despite increasing rates over the past couple of days, and the dollar lost momentum. Gold surged to a new record closing high.  

Bitcoin had a big week and raced back above its $67k level, and even oil prices jumped and nibbled at the $80 resistance level. Silver dramatically outperformed gold, as it topped its $30 price for the first time in many years.

And again, as traders are hanging on to the dream of lower rates, this chart makes it very clear that inflation remains a serious threat, and if it is to be conquered, interest rates need to move higher and not lower.

I think the Fed now realizes what it means to be caught between a rock and a hard place.

Read More

Weekly StatSheet For The ETF Tracker Newsletter – Updated Through 05/16/2024

Ulli ETF StatSheet Contact

ETF Data updated through Thursday, May 16, 2024

How to use this StatSheet:

  1. Out of the 1,800+ ETFs out there, I only pick the ones that trade over $5 million per day (HV ETFs), so you don’t get stuck with a lemon that nobody wants to buy or sell.
  1. Trend Tracking Indexes (TTIs)

These are the main indicators that tell you when to buy or sell Domestic and International ETFs (section 1 and 2). They do that by comparing their position to their long-term M/A (Moving Average). If they cross above, and stay there, it’s a green light to buy. If they fall below, and keep going, it’s a red light to sell. And to make sure you don’t lose your shirt if things go south, I also use a 12% trailing stop loss on all positions in these categories.

  1. All other investment areas don’t have a TTI and should be traded based on the position of each ETF relative to its own trend line (%M/A). That’s why I call them “Selective Buy.” In other words, if an ETF goes above its own trend line, you can buy it. But don’t forget to use a trailing sell stop of 12%, or less if you’re feeling nervous.

If some of these words sound like Greek to you, please check out the Glossary of Terms and new subscriber information in section 9.

  1. DOMESTIC EQUITY ETFs: BUY— since 11/21/2023

Click on chart to enlarge

This is our main compass, the Domestic Trend Tracking Index (TTI-green line in the above chart). It has broken above its long-term trend line (red) by +9.73% and is in “Buy” mode as posted.

Read More

Market Momentum Falters: Fed Grapples With Rate Decisions As Inflation Persists

Ulli Market Commentary Contact

[Chart courtesy of MarketWatch.com]

  1. Moving the markets

The major indexes inched higher early in, with the Dow conquering the milestone level of 40,000, a once thought to be an impenetrable level. In the end, momentum waned, and the majors closed off the highs.

The Dow’s progression toward 40,000 comes as unyielding belief of interest rate cuts and enthusiasm around artificial intelligence boosted investor sentiment, a trend that has been in motion for the past year.

Yesterday, the April reading of the CPI, a broad measure of how much goods and services cost at the cash register, increased 0.3% from the prior month, which was below the estimation of 0.4%.

As a result, the major indexes went on a rip, with the S&P 500 closing above 5,300 for the first time, a level which the index surrendered today.

Economic news painted a bleak picture with Industrial Production disappointing, US housing starts/permits coming in below expectations, and the Commodity index hitting its highest in a year, a clear sign that inflation is still out of control. All of this has pulled the Citi ECO Surprise index down to its lowest level since September 2022.

Bond yields rose, with the 10-year bouncing off its trendline. The dollar rebounded a tad, gold pulled back after yesterday’s strong surge, and crude oil rose but fell short of reaching its $80 level.

The economy continues to weaken, while inflation remains ever present, a set up that the Fed will have a hard time dealing with.

After all, if they raise rates, the economy will collapse, if they lower them, inflation will surge.   

Which will it be?

Read More