
ETF Tracker StatSheet
You can view the latest version here.
PUKING INTO THE WEEKEND
- Moving the markets
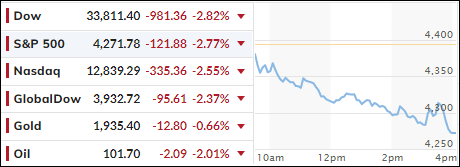
After yesterday’s pump and dump session, during which the Dow jumped to a 300-point lead early on, only to see those gains wiped out, with the index closing with a loss of almost 370 points.
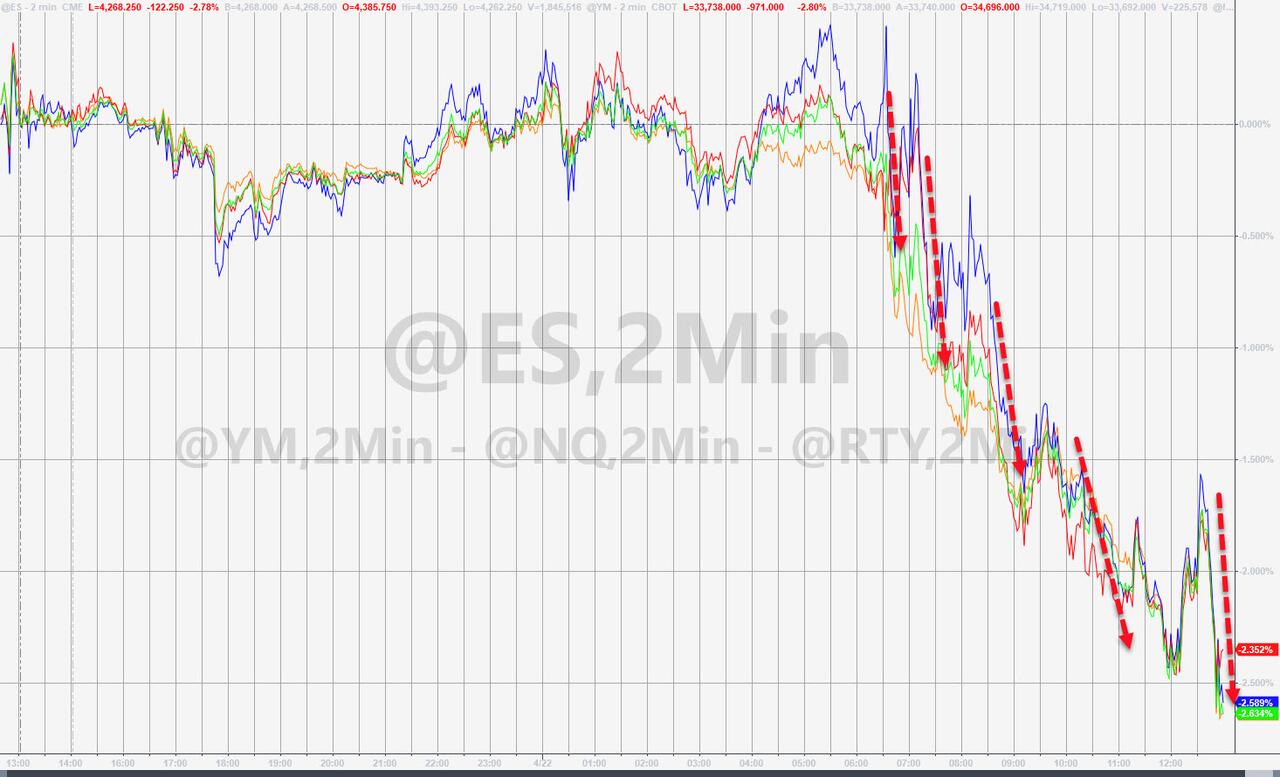
That bearish momentum continued during the overnight session and worsened after today’s opening, as the puke-a-thon picked up speed during the afternoon. At this moment in time, the late March melt up in the Nasdaq has been fully reversed, which to me means that it may have been nothing more than a dead-cat-bounce.
Headline news showed no encouraging developments anywhere, as these samples from ZeroHedge show:
- Whispers Of Yuan Devaluation After Biggest Weekly Plunge Since 2015 As Yen Craters
- Japan Begs US For “Coordinated Currency Intervention”, Is Rejected By Yellen
- Israel Dumps The Dollar For China’s Renminbi
- Markets Monkey hammered As Rate-Hike Expectations Soar
Some reality finally set in, as traders now had to price in a 50-bps (basis points) hike in both May and June, while some whispered of a potential 75 bps increase, as ZH pointed out. That was far more than expected, the bullish mood soured, and the bears picked up the baton and ran with it handing the Dow an almost 1,000-point loss.
Added ZeroHedge:
Fed mouthpiece Bullard warned that “the bond market is not looking like a safe place to be”; and Powell backed a one-two of 50bp hikes, which is now priced in. His goal is also “to get inflation down without a recession”. That’s like saying you want your opponent’s boxing gloves to hit the canvas but not the actual boxer. It’s a plan. Those are words. Just stupid ones.
In the end, there was no place to hide, as all asset classes were taken out to the barn and spanked with an assist given by disappointing quarterly results. Even the well-performing sector funds proved not to be immune to today’s thrashing.
Chief economist Jeanette Garretty summed it up like this:
This is all about Powell’s comments, but the cautionary remarks about future sales growth in so many earnings announcements are driving home the essential point: fighting inflation will inflict some pain.
No kidding.
If the Fed is serious about fighting inflation and not concerned with the effects on the markets, there is bound to be a lot more pain to come. That’s why it pays to be prepared via an exit strategy, should a full-fledged bear market develop and become reality.
2. ETFs in the Spotlight
In case you missed the announcement and description of this section, you can read it here again.
It features some of the 10 broadly diversified domestic and sector ETFs from my HighVolume list as posted every Saturday. Furthermore, they are screened for the lowest MaxDD% number meaning they have been showing better resistance to temporary sell offs than all others over the past year.
The below table simply demonstrates the magnitude with which these ETFs are fluctuating above or below their respective individual trend lines (%+/-M/A). A break below, represented by a negative number, shows weakness, while a break above, represented by a positive percentage, shows strength.
For hundreds of ETF choices, be sure to reference Thursday’s StatSheet.
For this just closed-out domestic “Buy” cycle, here’s how some of our candidates have fared:
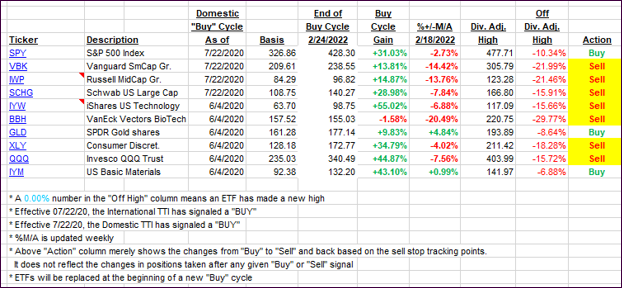
Click image to enlarge.
Again, the %+/-M/A column above shows the position of the various ETFs in relation to their respective long-term trend lines, while the trailing sell stops are being tracked in the “Off High” column. The “Action” column will signal a “Sell” once the -12% point has been taken out in the “Off High” column, which has replaced the prior -8% to -10% limits.
3. Trend Tracking Indexes (TTIs)
Our TTIs got slammed with the markets with the Domestic one finally also collapsing below its trend line, thereby confirming our bearish stance and only limited exposure to domestic equities.
This is how we closed 04/22/2022:
Domestic TTI: -1.84% below its M/A (prior close +0.95%)—Sell signal effective 02/24/2022.
International TTI: -3.30% below its M/A (prior close -1.00%)—Sell signal effective 03/08/2022.
Disclosure: I am obliged to inform you that I, as well as my advisory clients, own some of the ETFs listed in the above table. Furthermore, they do not represent a specific investment recommendation for you, they merely show which ETFs from the universe I track are falling within the specified guidelines.
All linked charts above are courtesy of Bloomberg via ZeroHedge.
———————————————————-
WOULD YOU LIKE TO HAVE YOUR INVESTMENTS PROFESSIONALLY MANAGED?
Do you have the time to follow our investment plans yourself? If you are a busy professional who would like to have his portfolio managed using our methodology, please contact me directly or get more details.
Contact Ulli