
ETF Tracker StatSheet
You can view the latest version here.
- Moving the markets
It was a wild and whacky holiday shortened week that sent the markets stumbling. The first 3 trading days featured identical results in that early bounces turned into late session trounces, as the major indexes got spanked much to the delight of the bears.
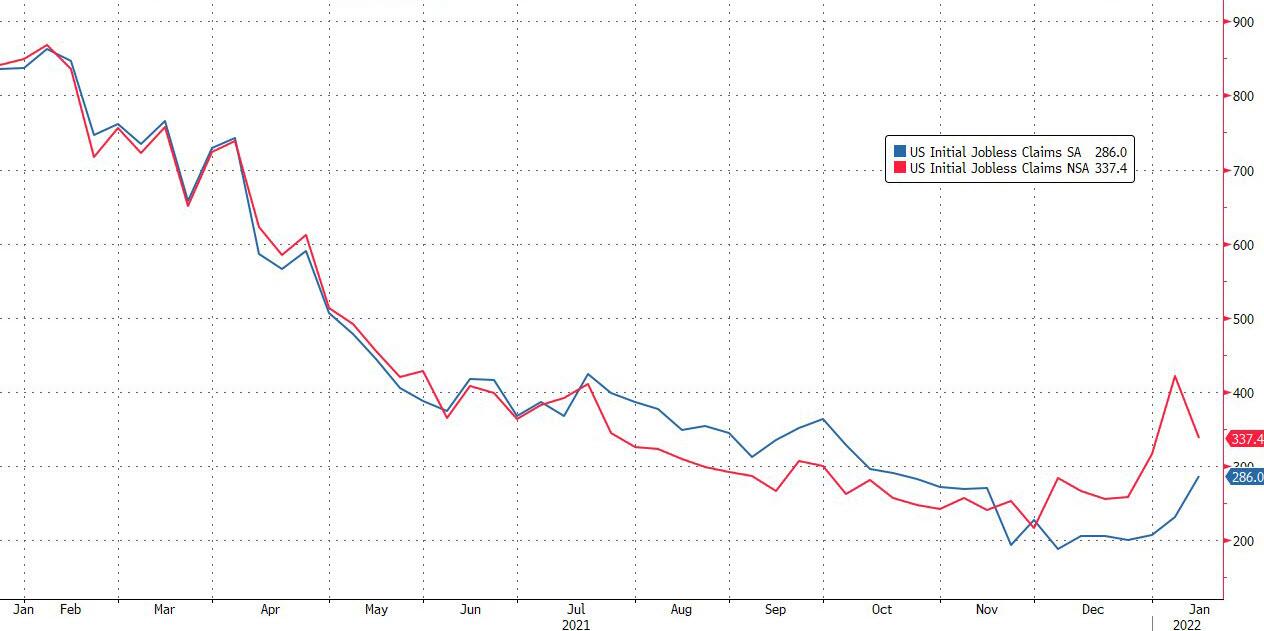
A variety of events combined to thrash any bullish sentiment. Yesterday, we learned that the economy is not all that it’s cracked up to be with Existing Home Sales crashing 4.6% MoM, which was the biggest drop since February 2021. Next up were Initial Jobless claims that unexpectedly surged from 231k to 286k (seasonally adjusted), way off expectations of 225k, and the highest number since October.
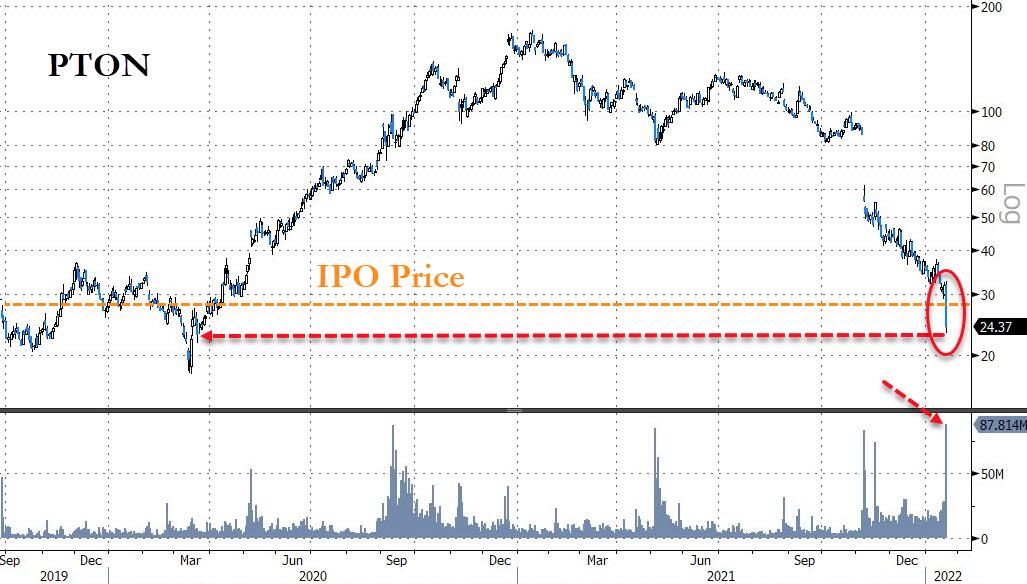
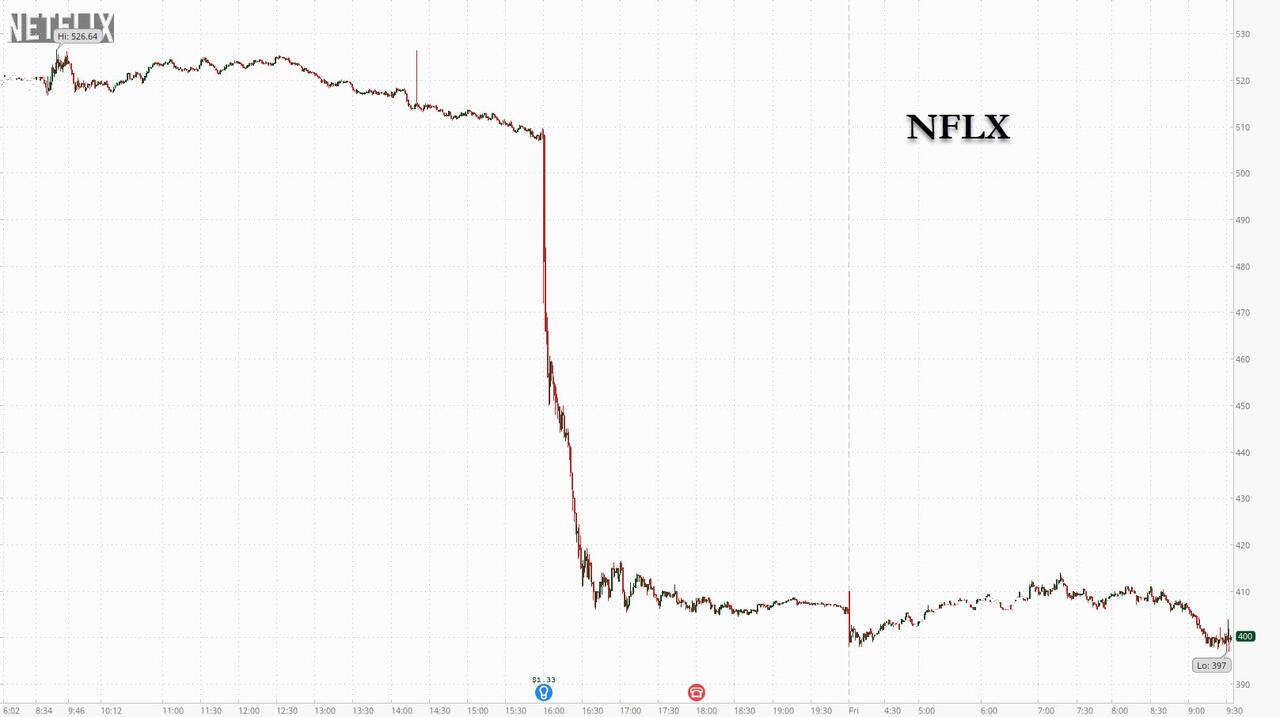
Then we faced poor results from Peloton and Netflix, whose stock prices imploded erasing any hope of a Nasdaq rebound. Ouch! Makes me wonder what the report cards for the other tech stocks will look like.
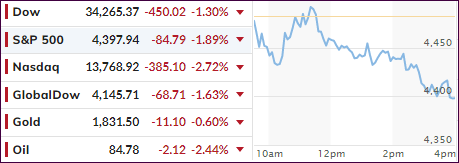
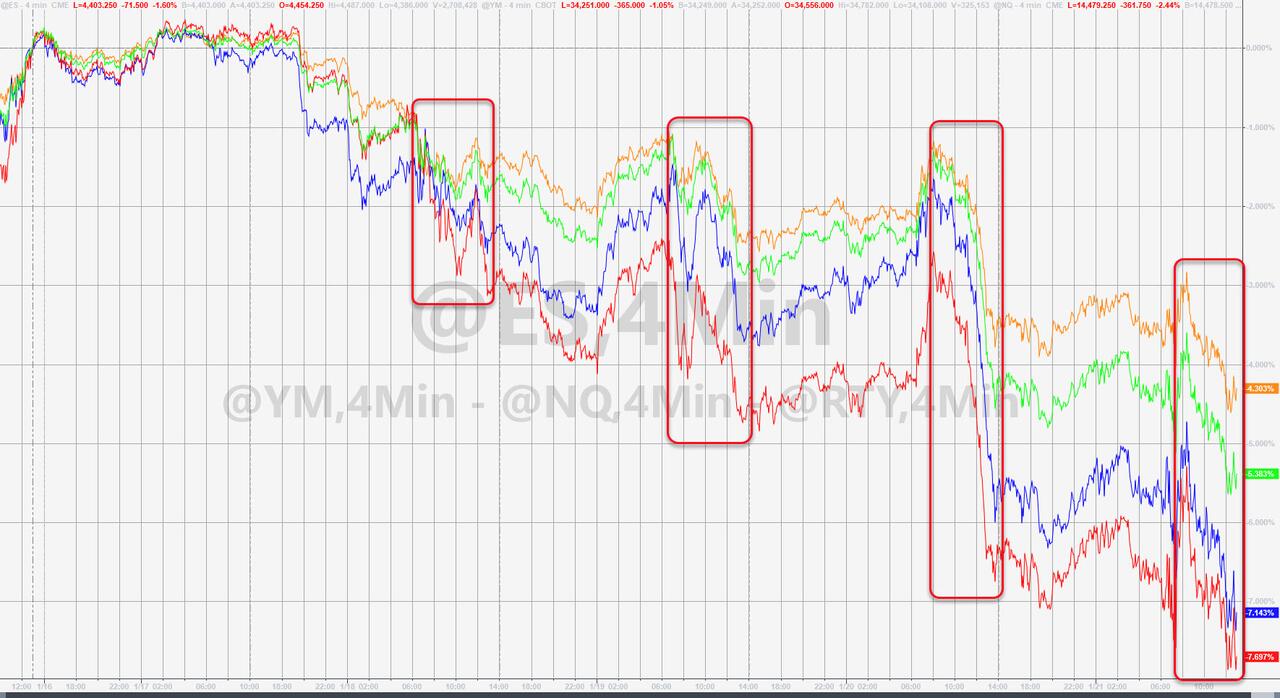
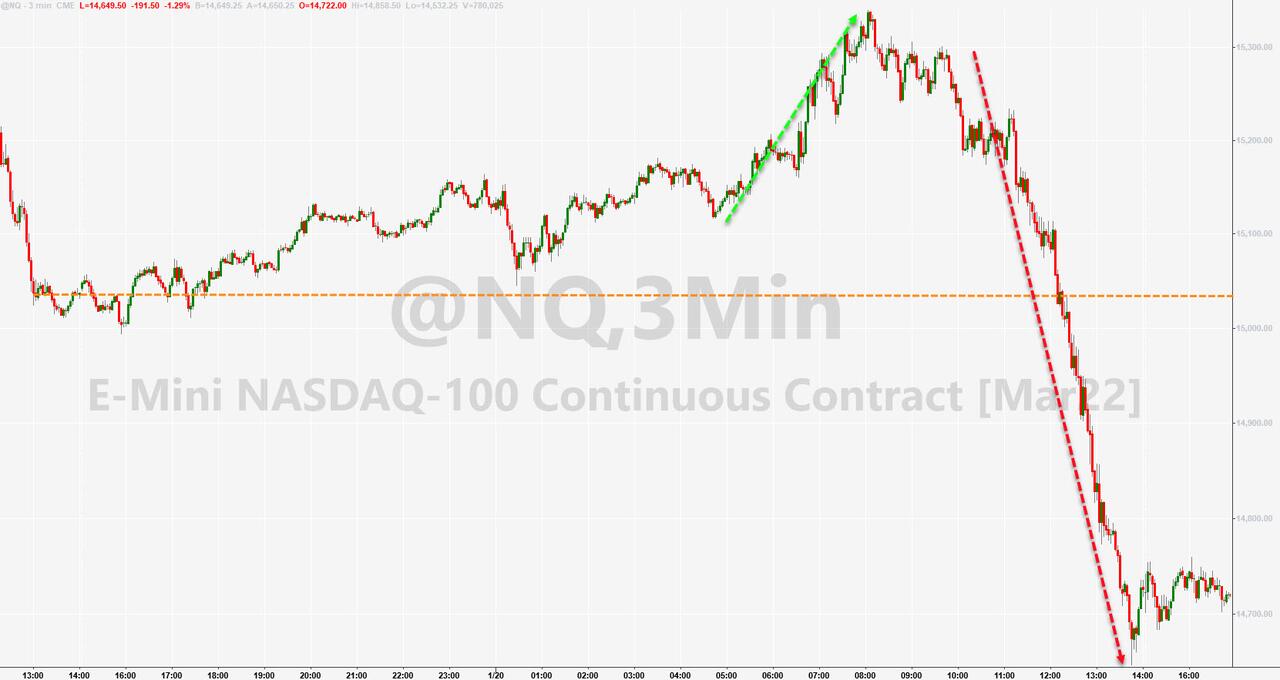
With a whopping $3.3 trillion in options expirations on deck for today’s session, the second largest ever, there were no green numbers to be found, as the major indexes again dove into the close. The Nasdaq led the puke-a-thon with a 2.72% loss despite bond yields trying to give a bullish assist with the 10-year dipping almost 5 basis points to end at 1.764%.
Again, there was no place to hide, as all sectors were taken to the barn and spanked, while both the Dow and S&P 500 closed their third week of losses and their worst weeks since 2020. The Nasdaq is now in correction territory, which means it has come down 14.25% from its November high.
Despite Gold’s modest pullback for the day, the precious metal has now rallied for the 5th week in the last 6 and hanging on above it’s $1,800 level, as ZH pointed out.
Our Trend Tracking Indexes both weakened with the Domestic one now having dipped into bear market territory for the first time since July 2020. Please see section 3 below for details.
What’s next? All eyes are now on Fed head Powell to see whether there is justified hope for him to start placating markets or resuming using his Q4 2018 playbook, which was more tightening followed by market implosions.
Nobody can be sure, but his upcoming policy meeting next Tuesday will likely be the most watched ever and may give some hints as to whether a dovish reversal is in the cards, or if he considers his hawkish inflation fighting policies to be of a higher priority.
2. ETFs in the Spotlight
In case you missed the announcement and description of this section, you can read it here again.
It features some of the 10 broadly diversified domestic and sector ETFs from my HighVolume list as posted every Saturday. Furthermore, they are screened for the lowest MaxDD% number meaning they have been showing better resistance to temporary sell offs than all others over the past year.
The below table simply demonstrates the magnitude with which these ETFs are fluctuating above or below their respective individual trend lines (%+/-M/A). A break below, represented by a negative number, shows weakness, while a break above, represented by a positive percentage, shows strength.
For hundreds of ETF choices, be sure to reference Thursday’s StatSheet.
For this current domestic “Buy” cycle, here’s how some of our candidates have fared:
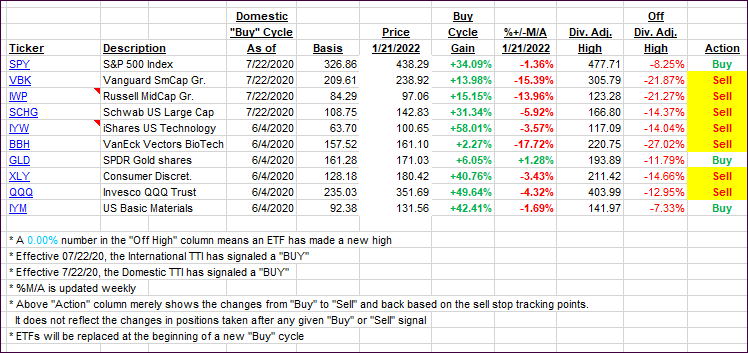
Click image to enlarge.
Again, the %+/-M/A column above shows the position of the various ETFs in relation to their respective long-term trend lines, while the trailing sell stops are being tracked in the “Off High” column. The “Action” column will signal a “Sell” once the -12% point has been taken out in the “Off High” column, which has replaced the prior -8% to -10% limits.
3. Trend Tracking Indexes (TTIs)
Our TTIs again retreated sharply with the Domestic one slipping below its long-term trend line and into bearish territory.
Since this is its first drop below the line, I will need to see more downside confirmation that this is indeed a trend reversal from bullish to bearish, before I announce this to be a “Sell” signal for “broadly diversified domestic equity ETFs and Mutual funds.”
This is how we closed 01/21/2022:
Domestic TTI: -0.57% below its M/A (prior close +1.02%)—Buy signal effective 07/22/2020.
International TTI: +2.31% above its M/A (prior close 4.00%)—Buy signal effective 07/22/2020.
Disclosure: I am obliged to inform you that I, as well as my advisory clients, own some of the ETFs listed in the above table. Furthermore, they do not represent a specific investment recommendation for you, they merely show which ETFs from the universe I track are falling within the specified guidelines.
All linked charts above are courtesy of Bloomberg via ZeroHedge.
———————————————————-
WOULD YOU LIKE TO HAVE YOUR INVESTMENTS PROFESSIONALLY MANAGED?
Do you have the time to follow our investment plans yourself? If you are a busy professional who would like to have his portfolio managed using our methodology, please contact me directly or get more details here.
Contact Ulli