
- Moving the markets
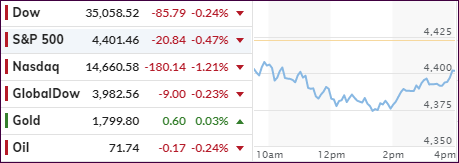
A couple of forces combined to slap the major indexes around until, late in the session, the markets found some footing and managed to reduce the early losses.
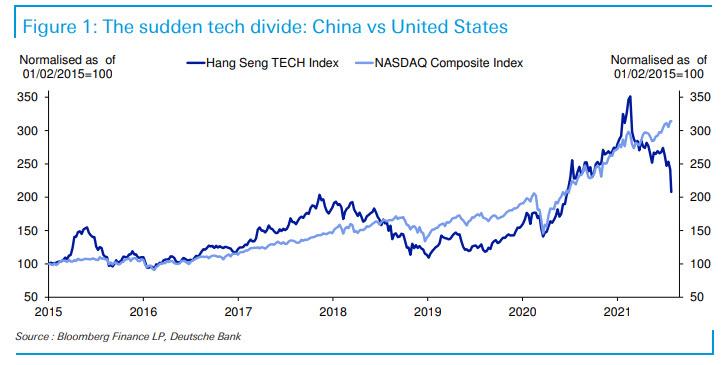
Leading the charge to the downside was what appeared to be the bursting of the tech bubble in China, with its Hang Seng Tech index having been sliding down a slippery slope since early this year (-43%).
When charted vs. the Nasdaq, similarities emerge making the already nervous Wall Street traders wondering whether this current disconnect is an advance warning of things to come here in the US.
While the answer is unknown, it was enough of an uncertainty to rattle the markets. Not helping matters, and accelerating weakness, was the latest in “science” after ‘Delta’ Masking headlines appeared and shrugging off all that had been settled before.
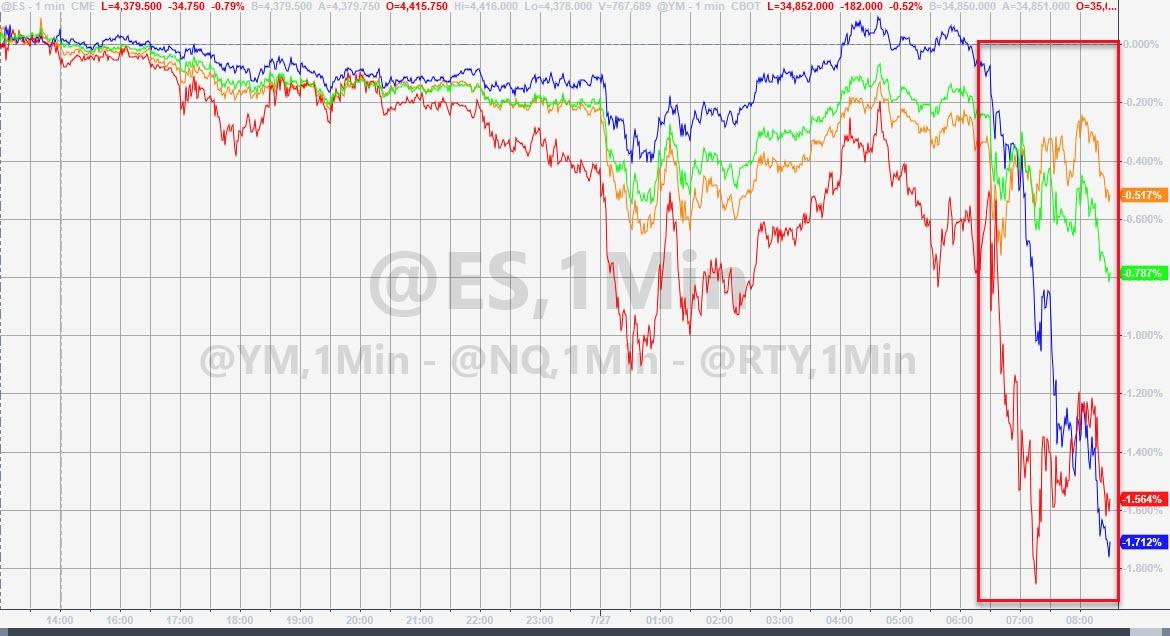
That proved to be unsettling for stocks, which made intra-day lows and contributed to the Nasdaq’s biggest daily drop since early May, as ZeroHedge reported. Small Caps were trounced at the rated of -1.14% (VBK) with the ETF faring far worse than its value cousin (RPV), which only bled -0.11%.
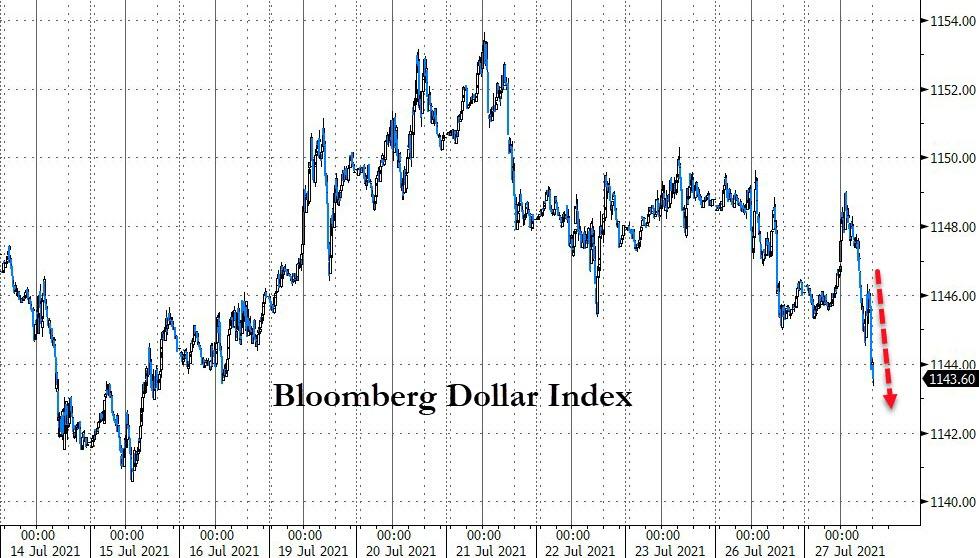
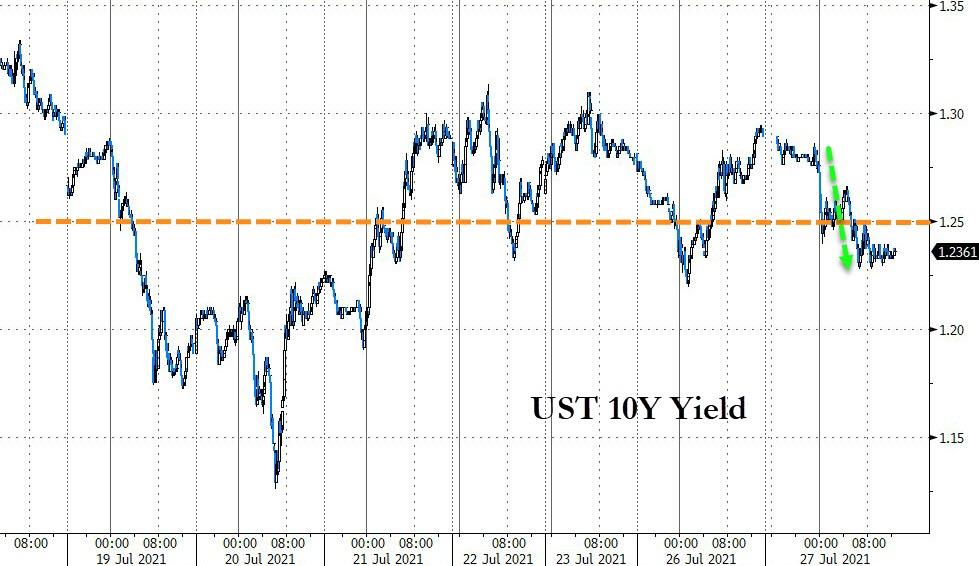
Not to be outdone, the US Dollar index dove in unison with bond yields, with the 10-year heading towards the 1.22% level. Gold worked both sides of its unchanged line and managed a meager yet green close (+0.18%).
On the earnings front, the tech heavyweights Alphabet, Microsoft, and Apple all are reporting this afternoon.
On deck tomorrow will be the result of the Fed’s latest two-day meeting, but expectations are for no earth-shaking announcements but more of the same rhetoric we hear every month.
2. ETFs in the Spotlight
In case you missed the announcement and description of this section, you can read it here again.
It features some of the 10 broadly diversified domestic and sector ETFs from my HighVolume list as posted every Saturday. Furthermore, they are screened for the lowest MaxDD% number meaning they have been showing better resistance to temporary sell offs than all others over the past year.
The below table simply demonstrates the magnitude with which these ETFs are fluctuating above or below their respective individual trend lines (%+/-M/A). A break below, represented by a negative number, shows weakness, while a break above, represented by a positive percentage, shows strength.
For hundreds of ETF choices, be sure to reference Thursday’s StatSheet.
For this current domestic “Buy” cycle, here’s how some our candidates have fared:
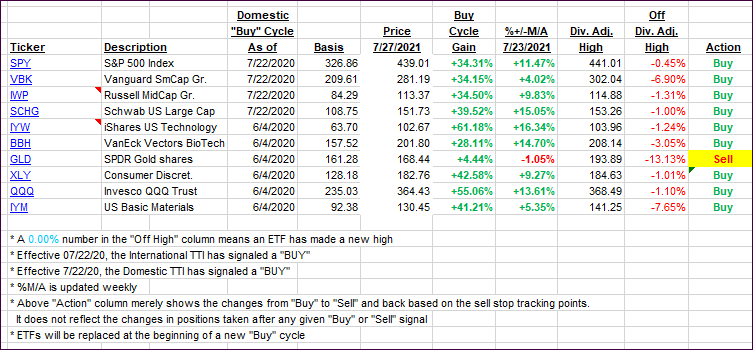
Click image to enlarge.
Again, the %+/-M/A column above shows the position of the various ETFs in relation to their respective long-term trend lines, while the trailing sell stops are being tracked in the “Off High” column. The “Action” column will signal a “Sell” once the -8% point has been taken out in the “Off High” column. For more volatile sector ETFs, the trigger point is -10%.
3. Trend Tracking Indexes (TTIs)
Our TTIs pulled back a tad, as uncertainty overshadowed any bullishness.
This is how we closed 07/27/2021:
Domestic TTI: +10.68% above its M/A (prior close +10.87%)—Buy signal effective 07/22/2020.
International TTI: +6.91% above its M/A (prior close +7.15%)—Buy signals effective 07/22/2020.
Disclosure: I am obliged to inform you that I, as well as my advisory clients, own some of the ETFs listed in the above table. Furthermore, they do not represent a specific investment
recommendation for you, they merely show which ETFs from the universe I track are falling within the specified guidelines.
All linked charts above are courtesy of Bloomberg via ZeroHedge.
Contact Ulli