
- Moving the markets
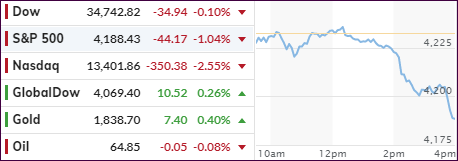
An early rally, at least for the Dow, petered out with all 3 major indexes diving into the close. The S&P 500 managed to hug its unchanged line for most of the day but succumbed to weakness in the end with the Nasdaq being the guilty party dragging down the indexes.
Technology continued its slump, making Friday’s gains look like a dead cat bounce, as traders rotated out of the high-flying tech sector and moved into companies better suited for a strong economic rebound.
“The tech price action is especially frustrating for many as the thought was Friday would elicit a more sustainable rebound in the space,” Adam Crisafulli, founder of Vital Knowledge, said in a note. “Instead, the group is seeing aggressive selling and accumulating technical damage as prices breach key levels.”
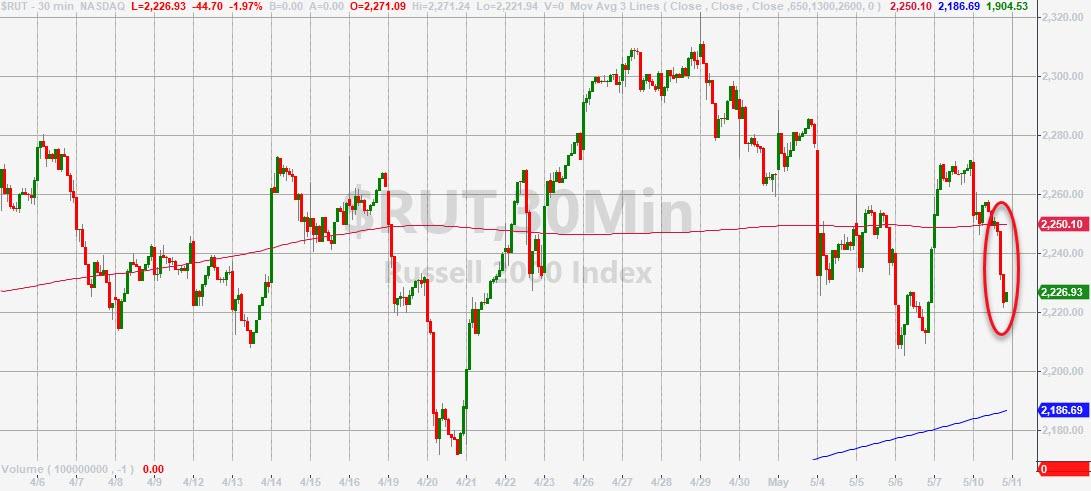
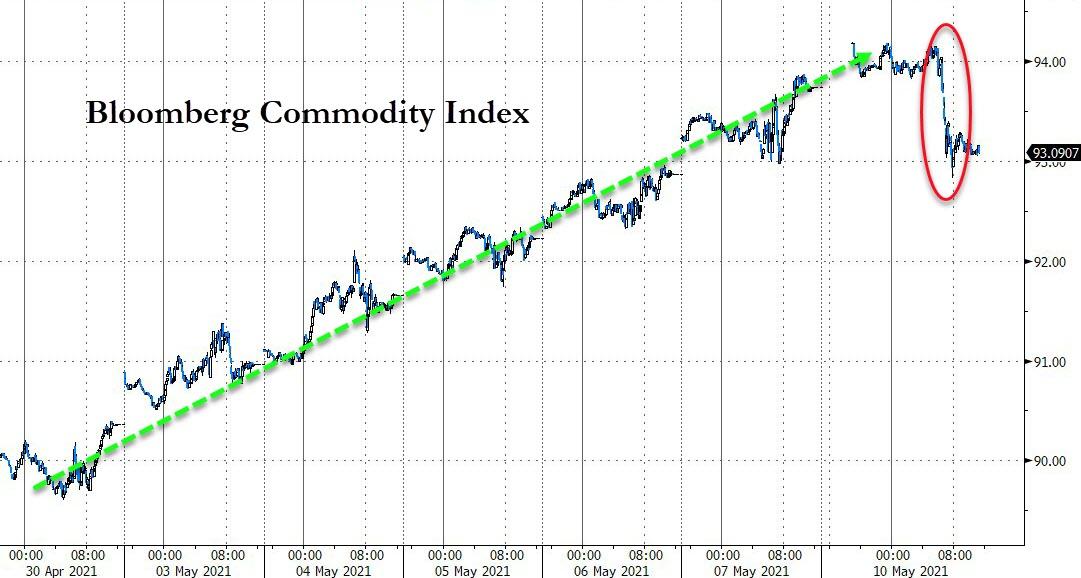
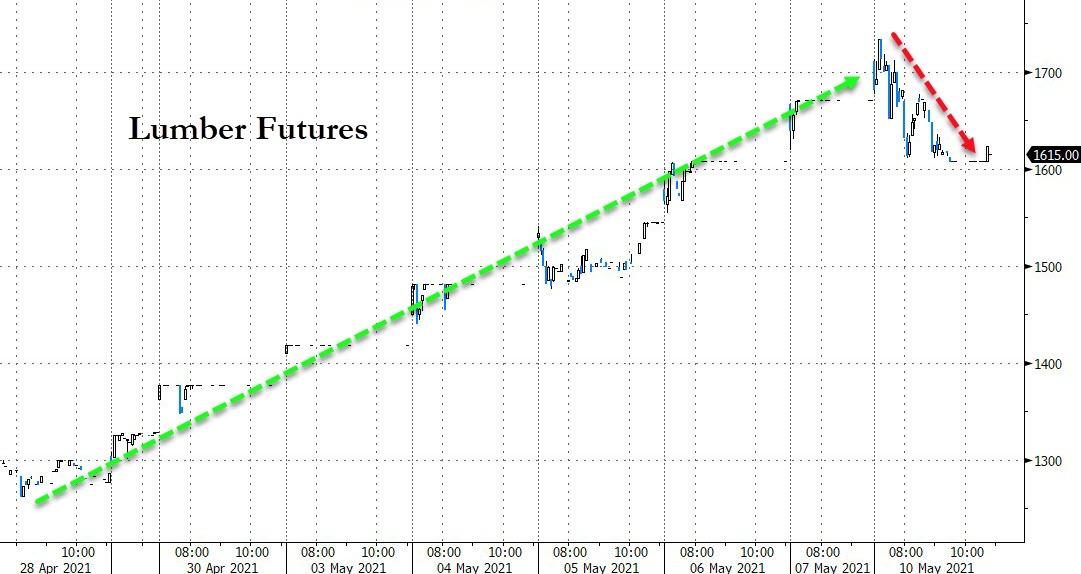
SmallCaps got thrashed with the widely held VBK losing 2.7%, and the sector closing below its 50-day M/A, as Bloomberg shows. Surprisingly, commodities reversed the northerly trend and gave back some of their recent gains, as did Lumber futures, whose reckless bullish ascent has contributed to sharply increased pricing for new homes.
Despite the US Dollar being flat, and the 10-year bond yield rising back above 1.60%, Gold managed to eke out a 0.35% gain and produced one of the few green numbers in today’s roller coaster ride.
It was a sloppy start to a new week, despite early promises, and may have been simply a hangover from Friday’s disgusting jobs report.
2. ETFs in the Spotlight
In case you missed the announcement and description of this section, you can read it here again.
It features some of the 10 broadly diversified domestic and sector ETFs from my HighVolume list as posted every Saturday. Furthermore, they are screened for the lowest MaxDD% number meaning they have been showing better resistance to temporary sell offs than all others over the past year.
The below table simply demonstrates the magnitude with which these ETFs are fluctuating above or below their respective individual trend lines (%+/-M/A). A break below, represented by a negative number, shows weakness, while a break above, represented by a positive percentage, shows strength.
For hundreds of ETF choices, be sure to reference Thursday’s StatSheet.
For this current domestic “Buy” cycle, here’s how some our candidates have fared:
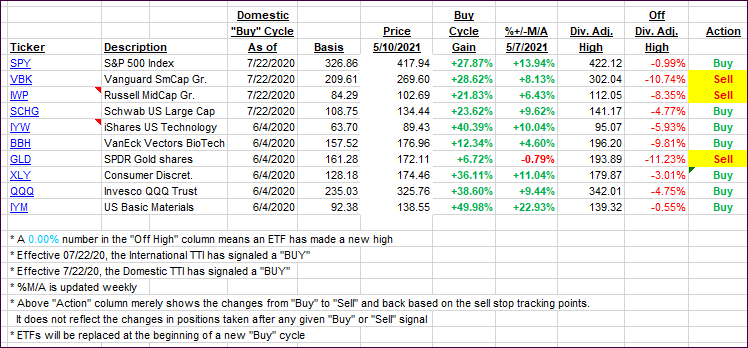
Click image to enlarge.
Again, the %+/-M/A column above shows the position of the various ETFs in relation to their respective long-term trend lines, while the trailing sell stops are being tracked in the “Off High” column. The “Action” column will signal a “Sell” once the -8% point has been taken out in the “Off High” column. For more volatile sector ETFs, the trigger point is -10%.
3. Trend Tracking Indexes (TTIs)
Our TTIs moved in opposite directions with the Domestic one slipping and the International one gaining a tad.
This is how we closed 05/10/2021:
Domestic TTI: +19.96% above its M/A (prior close +20.37%)—Buy signal effective 07/22/2020.
International TTI: +18.05% above its M/A (prior close +17.82%)—Buy signals effective 07/22/2020.
Disclosure: I am obliged to inform you that I, as well as my advisory clients, own some of the ETFs listed in the above table. Furthermore, they do not represent a specific investment recommendation for you, they merely show which ETFs from the universe I track are falling within the specified guidelines.
Contact Ulli