

- Moving the markets
While the Dow never managed to climb above its unchanged line, the S&P 500 showed some promising early gains, only to give them back late in the session. However, the Nasdaq resisted red numbers and closed in the green, along with GLD, which added a solid +2.36% for the session.
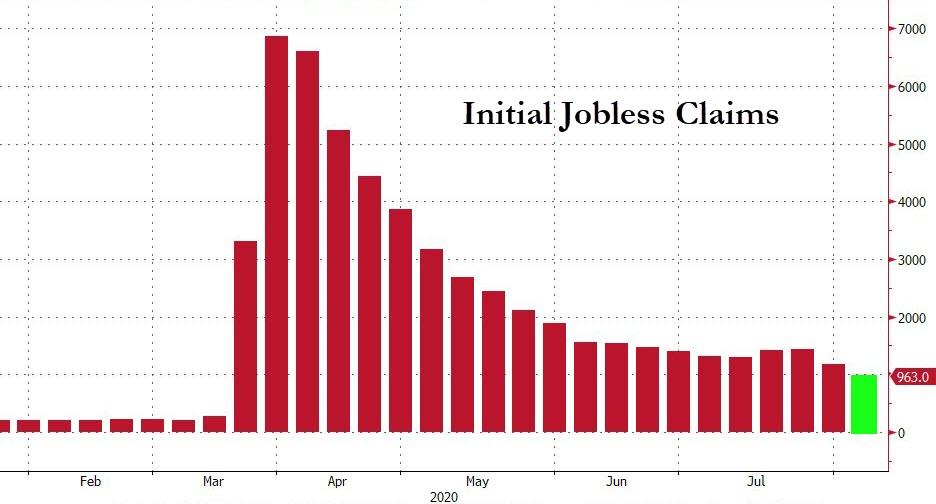
The latest jobs numbers showed initial claims falling below 1 million for the first time in 21 weeks, but still came in at a horrific 963k vs. 1.1 million expected.
Added ZH:
A total of 56.29 million Americans have now applied for jobless benefits for the first time since the pandemic lockdowns began (that’s over 360 layoffs for every COVID death in America), and massively more than the 22.1 million during the great financial crisis.
However, Despite today’s relatively positive news (yes 963,000 Americans still filed for first time benefits), following President Trump’s EOs, leaving the latest round of virus relief continuing to be stuck in gridlock, we suspect things will get depressingly worse before they get better.
That looks to be a possibility, as the ongoing impasse over Covid-19 relief is likely to drag into September with most lawmakers having retreated to their home states. In other words, we’ll have to wait for the next jawboning event.
This lack of action is what keeps the markets bouncing around with the S&P 500 continuing to sniff at its all-time high but falling short of closing above it.
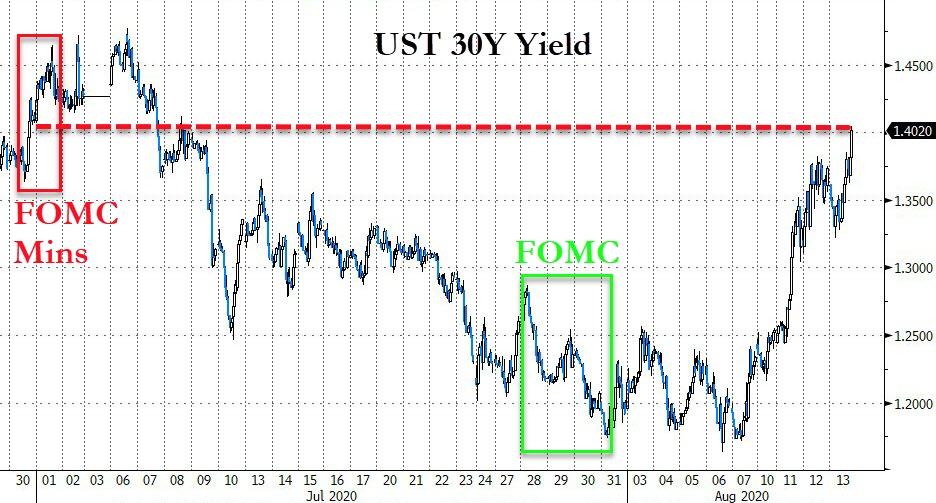
Not helping sentiment at all was the 30-year Treasury auction, which bombed, as yields spiked to a level last seen early July and thereby taking the steam out of the early equity rally. It was an oddity to see bonds down and gold up, since both usually run in tandem.
Oh well, I sure don’t mind seeing gold to be the winner in this battle.
2. ETFs in the Spotlight
In case you missed the announcement and description of this section, you can read it here again.
It features some of the 10 broadly diversified domestic and sector ETFs from my HighVolume list as posted every Saturday. Furthermore, they are screened for the lowest MaxDD% number meaning they have been showing better resistance to temporary sell offs than all others over the past year.
The below table simply demonstrates the magnitude with which these ETFs are fluctuating above or below their respective individual trend lines (%+/-M/A). A break below, represented by a negative number, shows weakness, while a break above, represented by a positive percentage, shows strength.
For hundreds of ETF choices, be sure to reference Thursday’s StatSheet.
For this current domestic “Buy” cycle, here’s how some our candidates have fared:
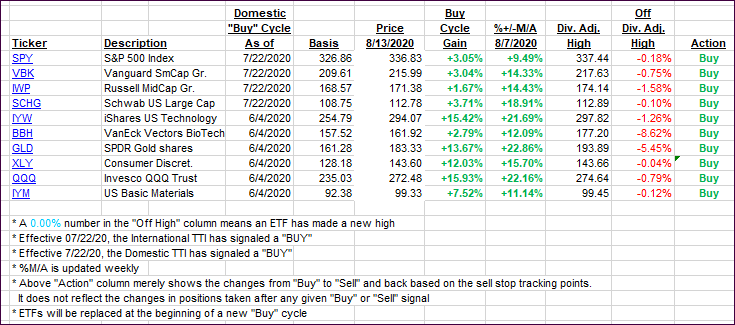
Click image to enlarge
Again, the %+/-M/A column above shows the position of the various ETFs in relation to their respective long-term trend lines, while the trailing sell stops are being tracked in the “Off High” column. The “Action” column will signal a “Sell” once the -8% point has been taken out in the “Off High” column. For more volatile sector ETFs, the trigger point is -10%.
3. Trend Tracking Indexes (TTIs)
Our TTIs came off their highs with markets being flat to down.
This is how we closed 08/13/2020:
Domestic TTI: +7.14% above its M/A (prior close +7.66%)—Buy signal effective 07/22/2020
International TTI: +5.05% above its M/A (prior close +5.49%)—Buy signal effective 07/22/2020
Disclosure: I am obliged to inform you that I, as well as my advisory clients, own some of the ETFs listed in the above table. Furthermore, they do not represent a specific investment recommendation for you, they merely show which ETFs from the universe I track are falling within the specified guidelines.
Contact Ulli