
- Moving the markets
Finally, the markets were able to build on early gains, with the bulls at last managing to score a winning session. As I posted Friday, I suspected as much due to balanced mutual funds having to go through their monthly rebalancing efforts this week.
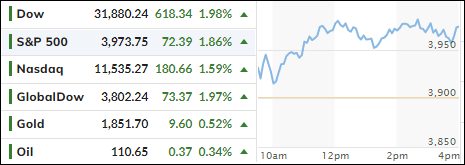
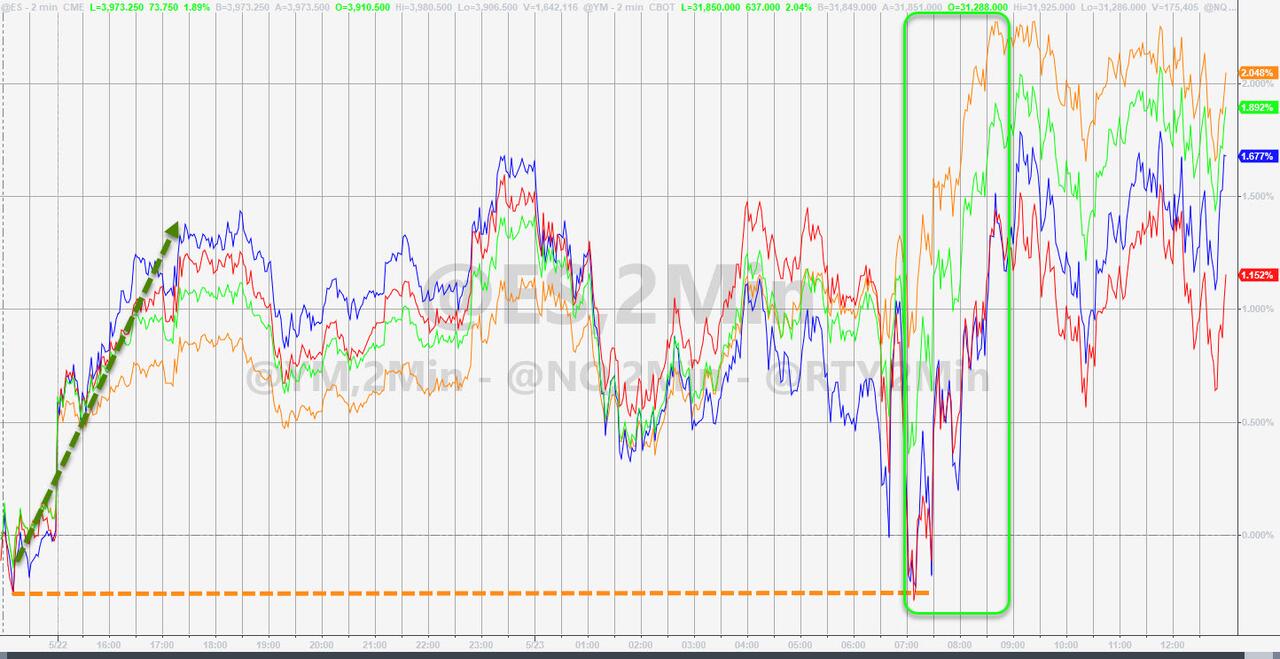
This move pulled the S&P 500 out of Friday’s officially reached intra-day bear market, which is defined as a drop of 20% from its latest high. Even the much-spanked Nasdaq ended up in the green with a 1.59% gain. Still, it will be a long, hard road for this index to recapture its recent 26% drop, especially after having seen seven down weeks in a row.
One analyst at Aviva investors captured the current market mood with this spot-on remark:
“Investors are trying to come to grips with what exactly is happening and always try to guess what the outcome is. Investors and the market hate uncertainty, and this is a period where they don’t have any clear indication on what’s going to happen with this push-pull between inflation and the economy.”
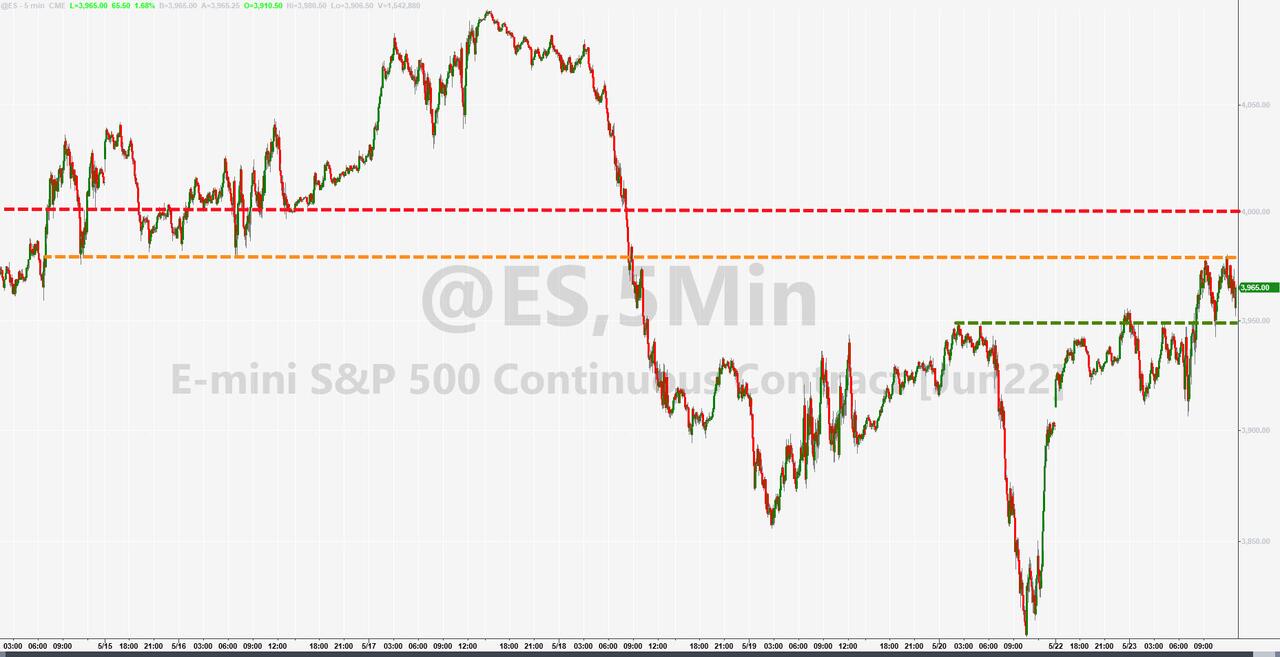
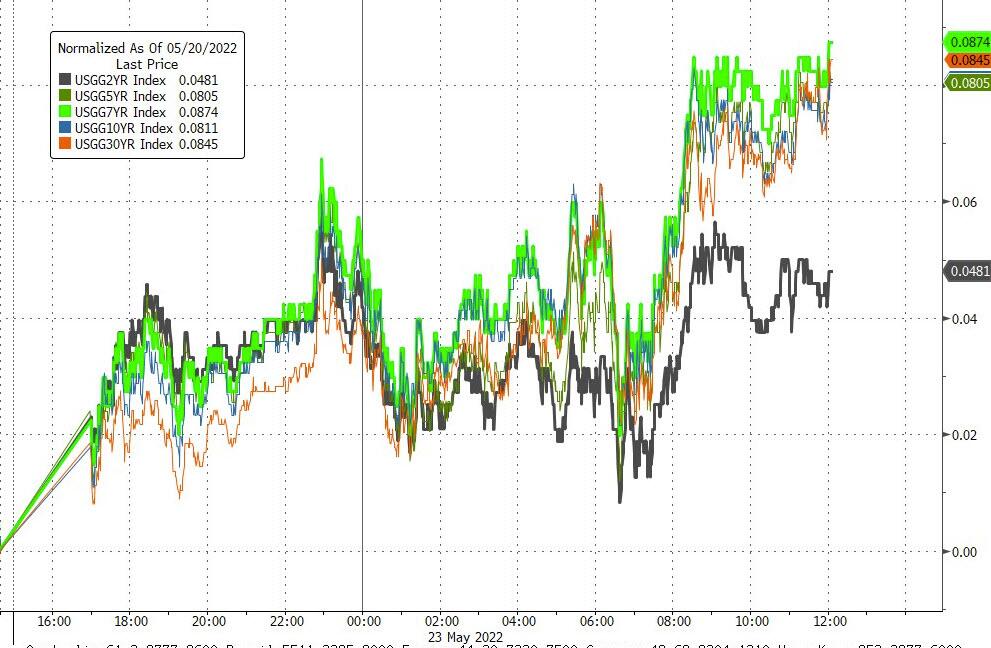
Despite today’s valiant effort, the S&P 500 fell short of recapturing its 4k level, as bonds were spanked, with the yield on the 10-year rising over 7 bps to 2.862%. That caused the widely held bond ETF TLT to drop -1.65% on the session, which brought its YTD performance down to -20.03%. Ouch!
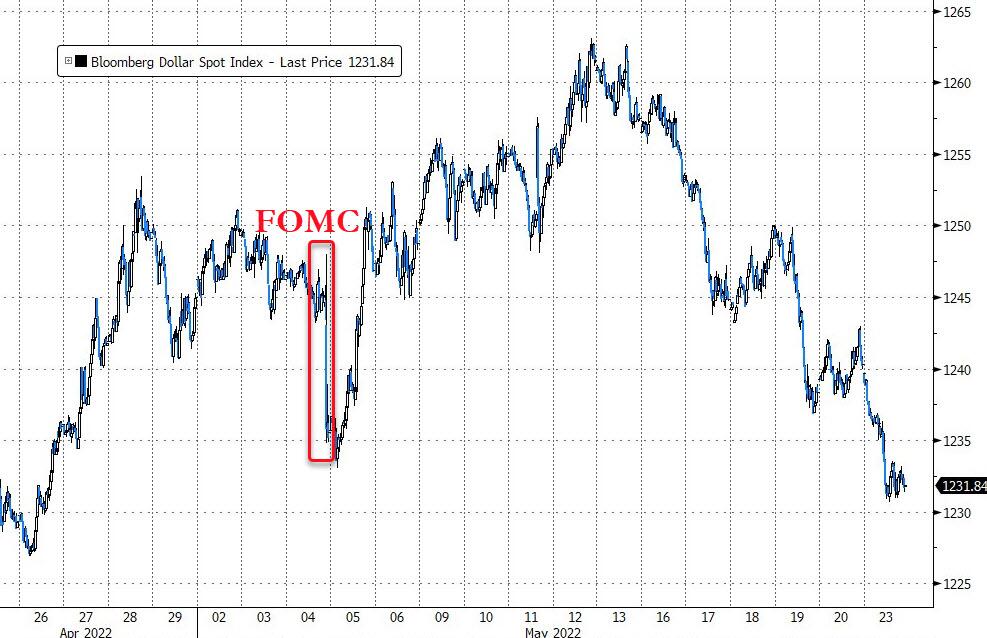
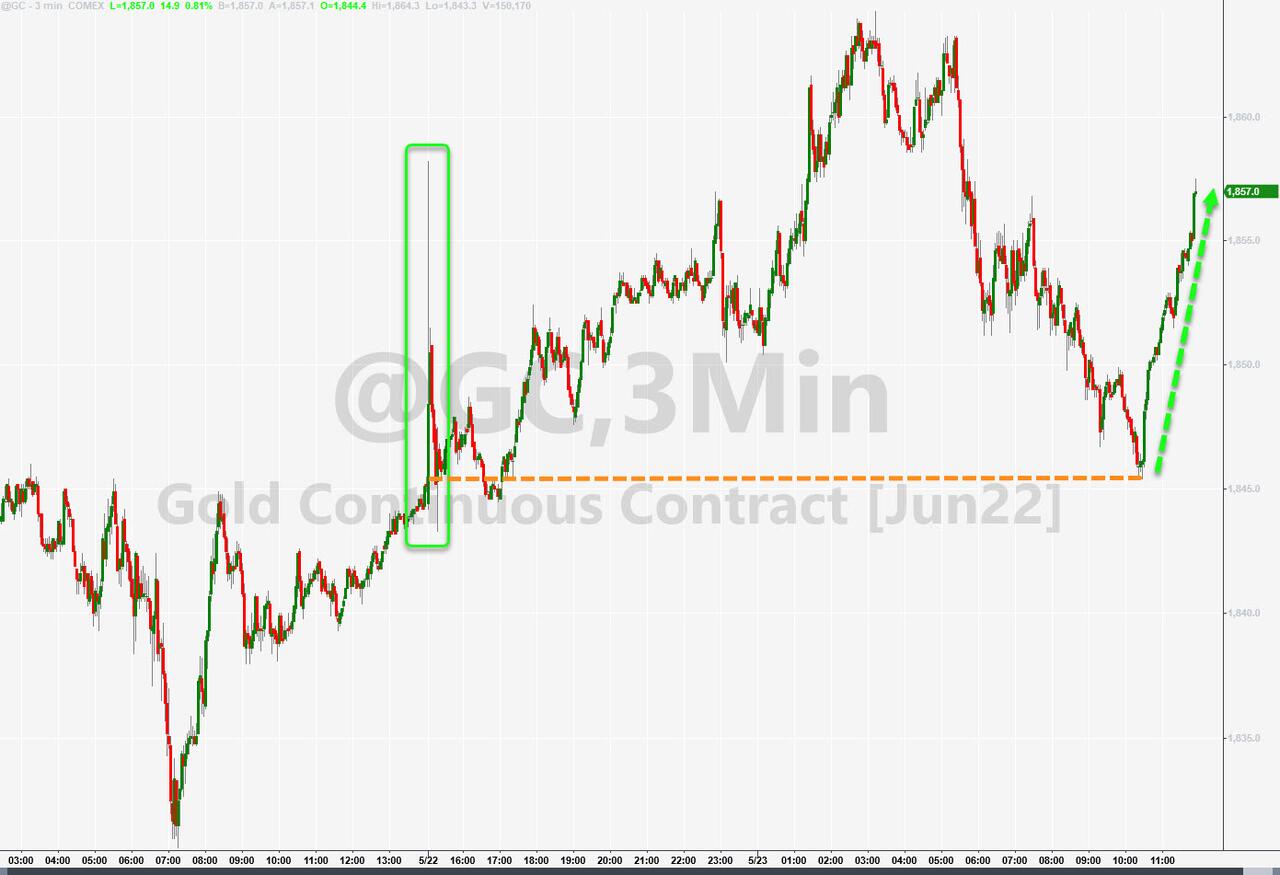
The US Dollar continued its slide, and gold rebounded 0.53% to inch closer toward its $1,900 level.
While today’s bounce gave traders some warm and fuzzy feelings, this bear market is far from being over, but it may take a pause and could very well present us with another head fake.
2. ETFs in the Spotlight
In case you missed the announcement and description of this section, you can read it here again.
It features some of the 10 broadly diversified domestic and sector ETFs from my HighVolume list as posted every Saturday. Furthermore, they are screened for the lowest MaxDD% number meaning they have been showing better resistance to temporary sell offs than all others over the past year.
The below table simply demonstrates the magnitude with which these ETFs are fluctuating above or below their respective individual trend lines (%+/-M/A). A break below, represented by a negative number, shows weakness, while a break above, represented by a positive percentage, shows strength.
For hundreds of ETF choices, be sure to reference Thursday’s StatSheet.
For this closed-out domestic “Buy” cycle (2/24/2022), here’s how some of our candidates have fared:
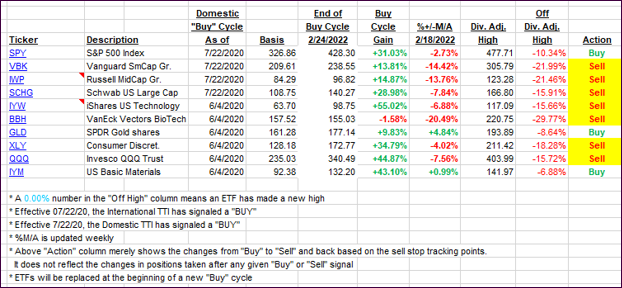
Click image to enlarge.
Again, the %+/-M/A column above shows the position of the various ETFs in relation to their respective long-term trend lines, while the trailing sell stops are being tracked in the “Off High” column. The “Action” column will signal a “Sell” once the -12% point has been taken out in the “Off High” column, which has replaced the prior -8% to -10% limits.
3. Trend Tracking Indexes (TTIs)
Our TTI’s improved, as the bulls finally saw upward momentum hold into the close.
This is how we closed 05/23/2022:
Domestic TTI: -7.34% below its M/A (prior close -8.63%)—Sell signal effective 02/24/2022.
International TTI: -5.94% below its M/A (prior close -7.73%)—Sell signal effective 03/08/2022.
Disclosure: I am obliged to inform you that I, as well as my advisory clients, own some of the ETFs listed in the above table. Furthermore, they do not represent a specific investment recommendation for you, they merely show which ETFs from the universe I track are falling within the specified guidelines.
All linked charts above are courtesy of Bloomberg via ZeroHedge.
Contact Ulli